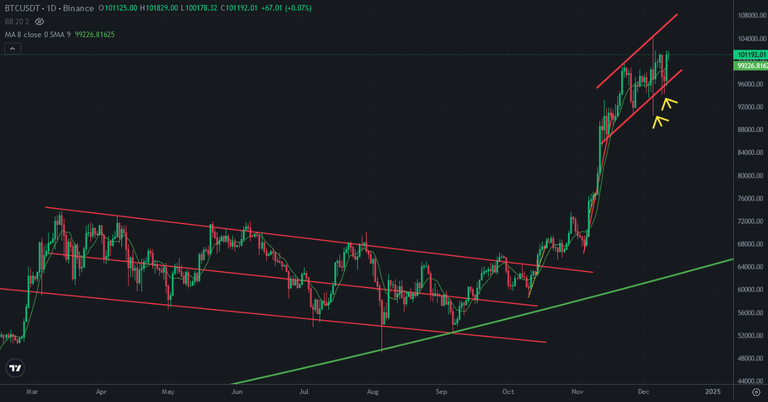
There are bearish traps on Bitcoin price chart. Bitcoin price is in flag pattern. It is ascending flag pattern. Even Bitcoin price broke down the bottom line of this pattern, price went up into this pattern. There are 3 bearish trap on this pattern.
Flag pattern has paralel top and bottom lines. Bitcoin price is at the middle level of this channel.
If Bitcoin price breaks down this pattern, we will see huge price correction on Bitcoin price chart.
Here you can see daily chart of Bitcoin. We have seen these bearish and bullish traps on flag pattern in this year.
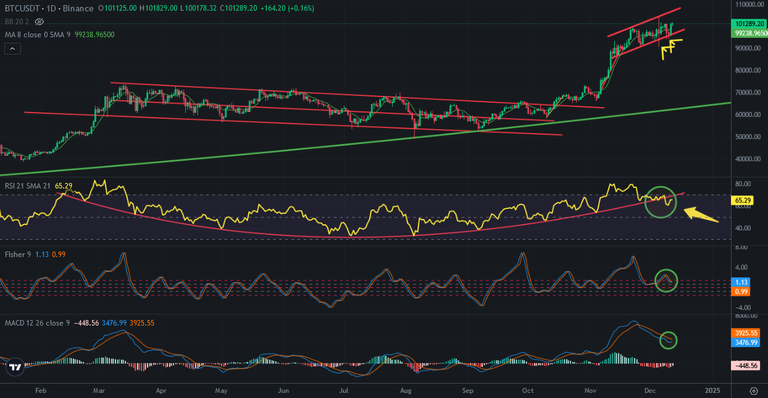
When we look at the indicators on daily chart of Bitcoin, RSI Indicator is going down. Even price is going up, RSI Indicator is going down. It is negative divergence on Bitcoin price chart.
MACD Indicator is at correction. It is still so high. It needs a few weeks to complete correction. Fisher Indicator is trying to reverse up but its level too high.
These are negative signals on Bitcoin price chart.
So, If Bitcoin price breaks down flag pattern again, it may not be a bearish trap. It may go down and enter price correction.
I shared a few analysis about possible price correction on Bitcoin price chart. I was waiting for this correction until Christmas. It is on the table again. Bitcoin may enter price correction. So, we should be careful
We will see..
Posted Using InLeo Alpha

