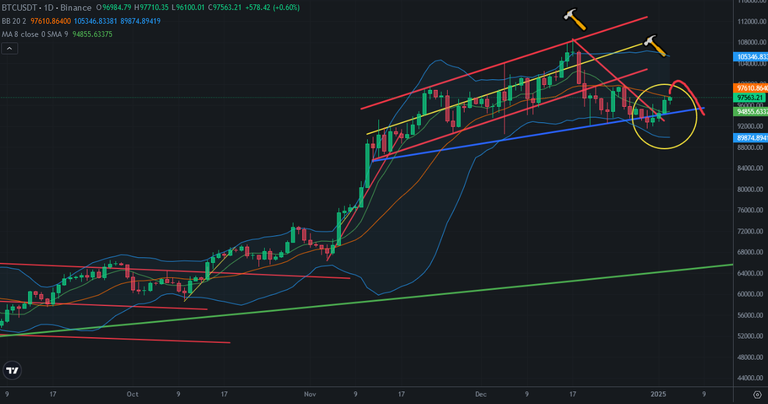
Today Bitcoin price touched the middle line of Bolliner Bands in daily chart. It is one of great resistance for short term. Bitcoin price touched a few days ago this resistance.
Here you can see daily chart of Bitcoin. Bitcoin price tested this resistance at the end of 2024 and we have seen huge daily red candle in this chart. It may be hard to break up. If Bitcoin price can not break up this resistance in this week, we may see price dump again in Bitcoin price chart.
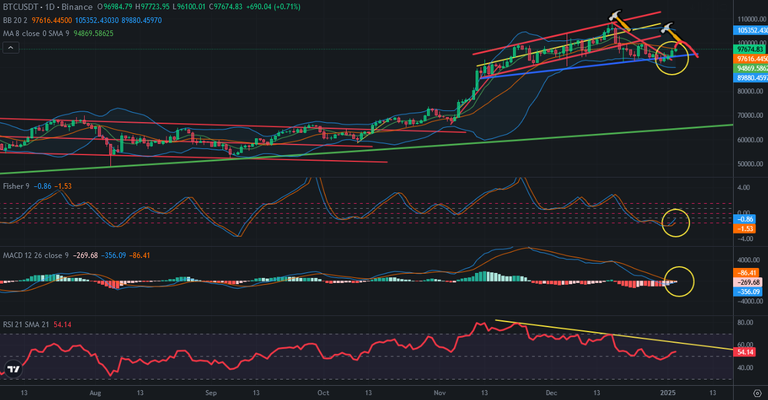
Here you can see daily chart of Bitcoin price. MACD Indicator is close to reverse up. It may reverse tomorrow. It is good to see for midterm for Bitcoin price chart as bullish. Fisher Indicator is also reversed from the bottom. These are good bullish signals for Bitcoin price chart. Even there are bullish signals on Bitcoin price chart, there is downtrend line on RSI Indicator. Bitcoin price may touch this resistance on RSI Indicator a few days later.
So, this price pump may be dead cat bounce. Because RSI Indicators resistance is very hard to break up..
So, we should be careful for this price pump. It may take short time.
We will see..
Posted Using InLeo Alpha


