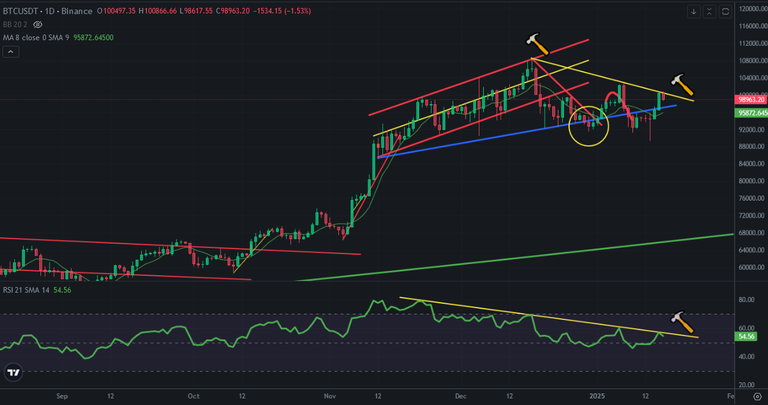
Bitcoin price touched 100.xK USD and reversed down. Even Bitcoin price touched 8xK USD in this week, it reversed and went up fast. I shared a few analysis about Bitcoin price chart and Bitcoin price would touch downtrend lines on price and indicators charts. It happaned. After touching these downtrend lines Bitcoin price went down. Because they are great resistance for Bitcoin price chart.
Here you can see daily chart of Bitcoin. I shared this draft a few weeks ago. There was great downtrend lines on Bitcoin price chart. Bitcoin price touched downtrend line coming from all time high, RSI Indicator touched downtrend line as great resistance.
So, it will be hard to break up these resistances for Bitcoin price chart.
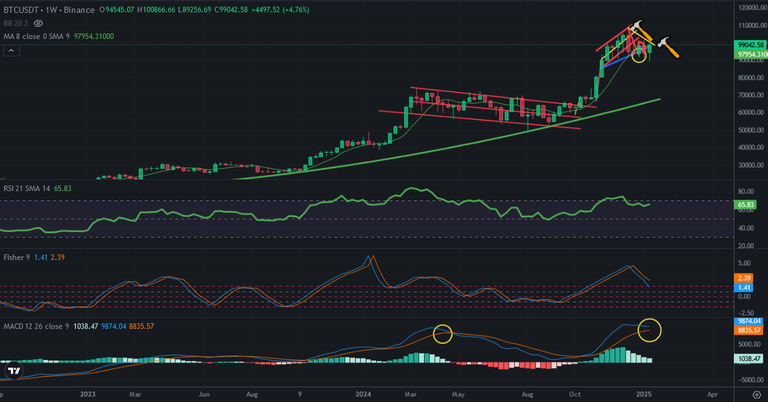
Here you can see weekly chart of Bitcoin. MACD Indicator is on the top. If Bitcoin price can not break up downtrend lines in a few days, MACD Indicator may reverse down at weekly chart. It is a bearish signal for Bitcoin price chart. So, Bitcoin price should break up downtrend lines. You can see what happened when MACD Indicator reversed down.
It will be very hard to break up downtrend lines. They are tested 2 times before. It may be early. Bitcoin price may need more time to break up. It will be reason for price correction on Bitcoin price chart.
We will see..
Posted Using INLEO

