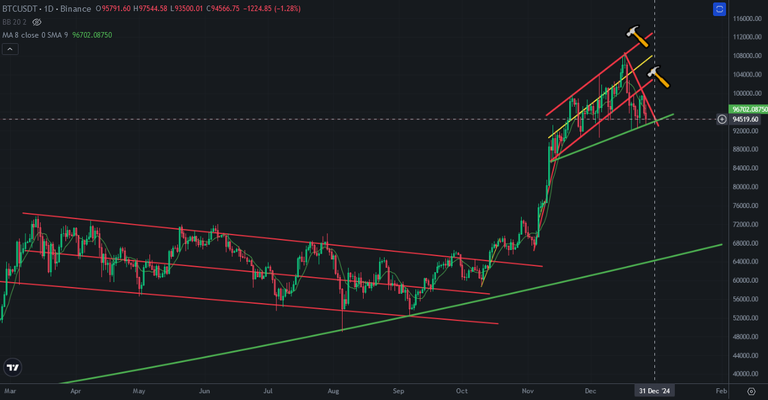
Today Bitcoin price tested to break down support line coming from end of November. It supported Bitcoin price 4 times before. If Bitcoin breaks down this line, we may see huge price drop on Bitcoin price chart. Even there is support line on Bitcoin price chart, There is downtrend line close to Bitcoin price chart.
Here you can see daily chart of Bitcoin. Bitcoin will break up or down these line until the new year. We will see huge price moves after breaking up or down. Bitcoin price stuched into this pattern and It will pump or dump fast after make a decision.
I think It may be early to break up..
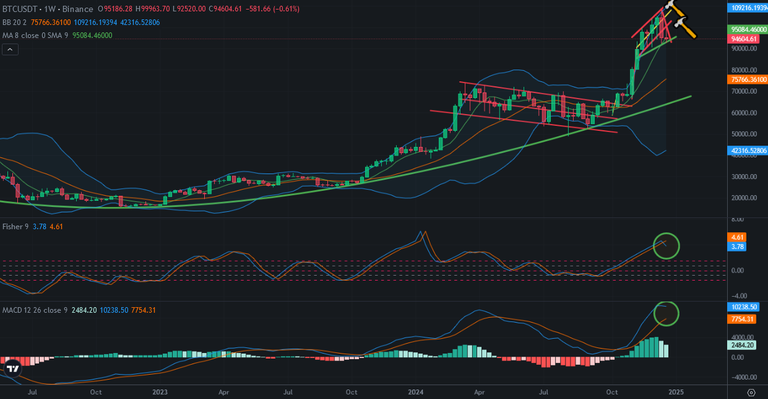
Here you can see weekly chart of Bitcoin. This is why I said It could be early to see breaking up.
There is fisher Indicator on the top and reversed. This is only the first week after reversing down.
MACD Indicator is goind down. It may reverse if we see red candle in next week. So, Market maker may not want to break down. If it reverses down, we will see midterm price correction on Bitcoin price chart. It may take a few weeks. We will see the decision of market maker in next week..
I think we may enter midterm price correction on Bitcoin price chart. It is good for longterm run.
As I said, we need to see price correction on Bitcoin price chart. I will follow Bitcoin price until end of this year. It Bitcoin breaks down support line it may go down to 7xK USD, where the middle line of Bollinger Bands on weekly chart of Bitcoin.
We will see..
Posted Using InLeo Alpha

