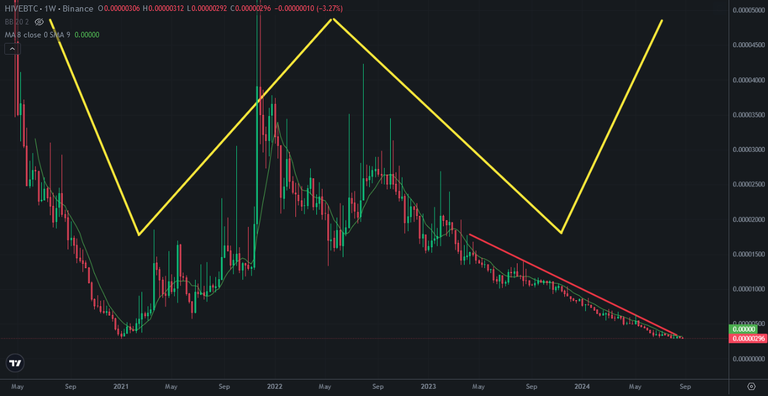
Hive/BTC pair chart is on the bottom. Double bottom pattern seemes on this chart. There is huge W pattern on Hive/BTC pair chart. I shared lots of analysis for this pair chart and showed possible pattern. This is great pattern for bullish investors. Lots of investors are seeing this chart as me!
Here you can see daily chart of Hive Bitcoin pair chart. It is trying to hit the bottom to complete double bottom pattern.
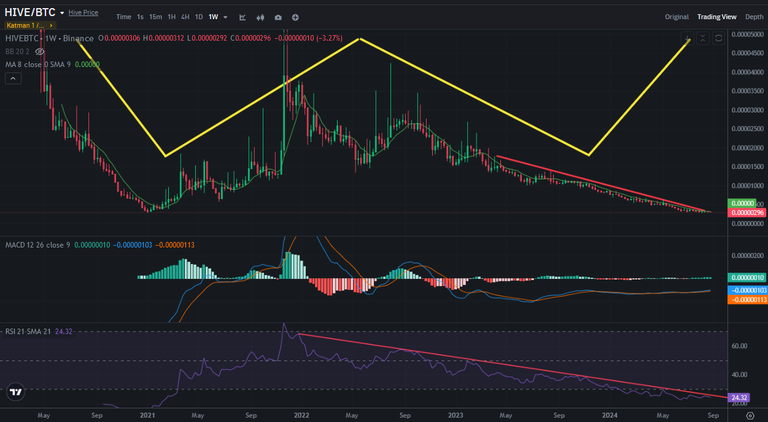
It seems as reversing from the bottom. No matter how hard ittries to go down, it can't..
When we look at the indicators on this chart, we can see the beginning of altcoin season. There is RSI Indicator below this chart and It is break up downtrend line of RSI Indicator.
If it breaks up, the last line of W pattern will be drawn. We will see huge price ups on Hive price chart.
I believe Hive will be star of altcoin season. Lots of whales may see this chart.
We will see..
Posted Using InLeo Alpha