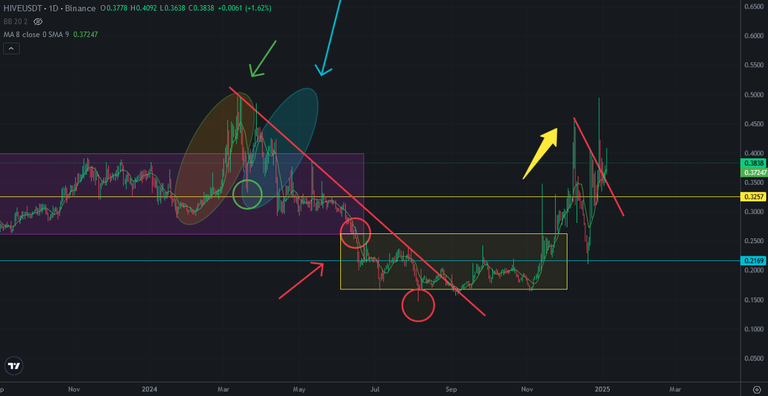
Hive price is still on the trend. It is trying to break up resistance. Here you can see daily chart of Hive price. I drew this draft a year ago and I worked as well. Hive price met with the top line of consolidation zone and It is hard to break up. We should see daily close above this resistance on Hive price chart
Hive price is still on the trend. It is above 8-day moving average which shows us short term trend. Hive is in bullish trend for short-middle and long-term. You can see what happaned after being on and below this average..
0,42 USD is great resistance for Hive price chart. Hive should make daily close above this level. Bitcoin price should support market. We will see the decision of the market in this month..
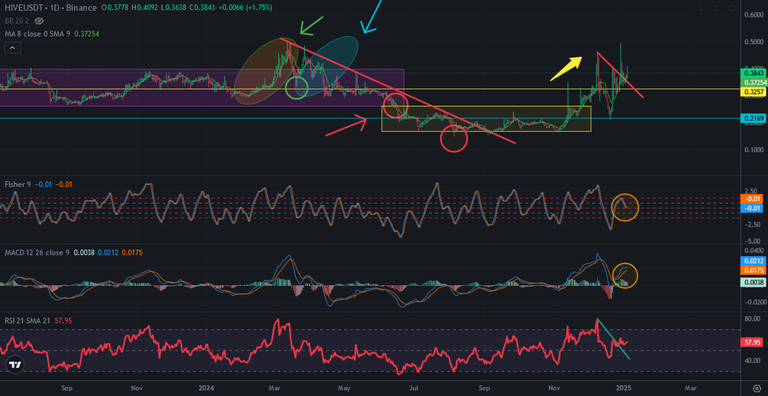
Here you can see the indicators on daily price chart of Hive. Fisher Indicator is trying to reverse up. MACD Indicator still has not a decision. Even it is trying to reverse down, today's price pump increased the level of MACD Indicator. RSI Indicator has broken up downtrend line.
So, we can not say that it shows us bullish or bearish. It is not clear to see the future on Hive price chart as Bitcoin price chart.
So, Waiting to see daily close above 0,42 USD is great choice to invest. I said, I would watch the market until end of January
We will see..
Posted Using InLeo Alpha

