Bitcoin price can not go up. Lots of investors were waiting for new all time high in Summer. Summer ends and we have not seen new all time high. We saw lots of bullish traps on Bitcoin price chart.
I shared lots of analysis about Bitcoin price chart. I warned lots of times you about bullish traps on Bitcoin price chart. Bitcoin price went up from 47K to 64K in short time. I could not go up all time high level...
Here you can see why Bitcoin price could not go up! Here you can see weekly indicators on Bitcoin price chart. All of the are resisted! They can not go up. They need more time to complete correction pattern!
MACD Indicator is on the top and you can compare its level with 2021. It need more weeks to complete correction.
RSI Indicator resisted by downtrend line. It tested 3 times to break up and I could not..
Fisher Indicator is at below and It is also resisted by downtrend line! It is hard to break up.
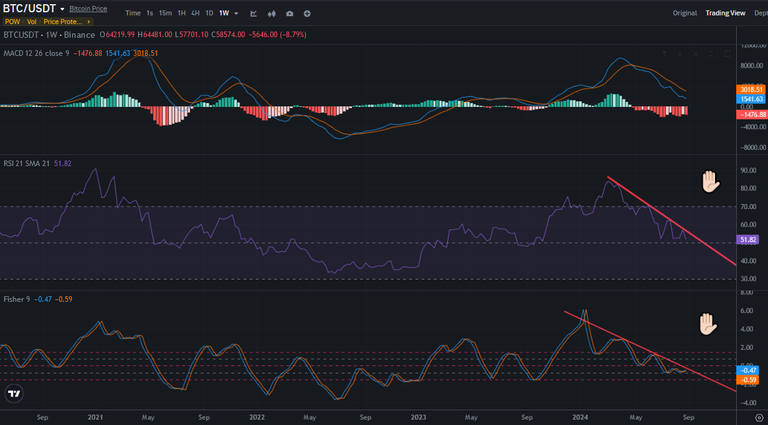
We need more weeks to complete price correction.
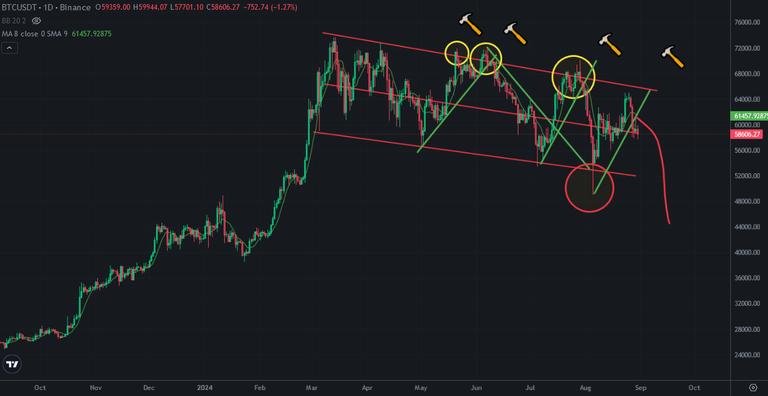
Here you can see daily chart of Bitcoin and there is descending channel on this chart. Bitcoin price supoorted by the middle line of this channel. We may see the touch of bottom line of this channel.
When we look at the indicators, I drew my prediction for Bitcoin price move.
I am waiting with my cash while following the indicators. If Bitcoin breaks up the resistance, Bitcoin will break up all time high.
You should follow these indicators to see when reversing will be.
Posted Using InLeo Alpha