There is mega possitive divergence on Hive price chart. Hive price is at 0,165 USD level and trying to reverse. Even Bitcoin price went down this week, Hive price was solid. Because it was undervalued. There is no place to go down! There is mega possitive divergences that help Hive price to be solid even market goes down..
Here you can see daily chart of Hive. There is 4 bottom on daily chart of Hive. These bottom are goind down. Even these bottom are goind down, the bottoms on RSI Indicator is goind up. This is great signal to reverse. This may be first possitive divergence I have ever seen 4 bottoms.
After this divergence completed, We may see huge price pumps on Hive price chart!
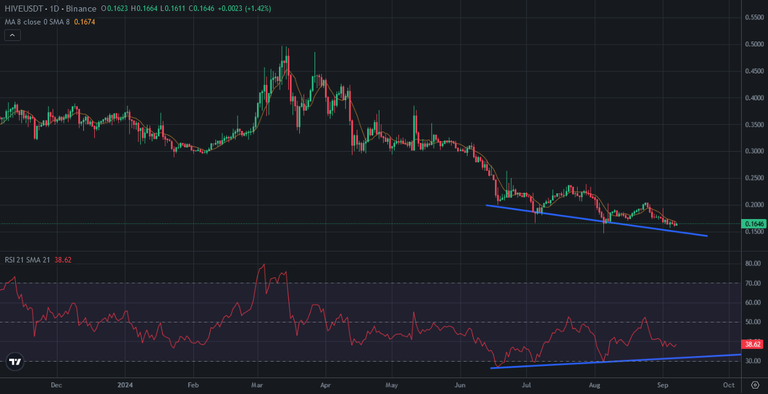
I shared lots of bullish analysis about Hive price chart. I started to buy when I saw Hive price below 0,165 USD and I power up Hive. After seeing this possitive divergence, I added a reason that I should buy more Hive!
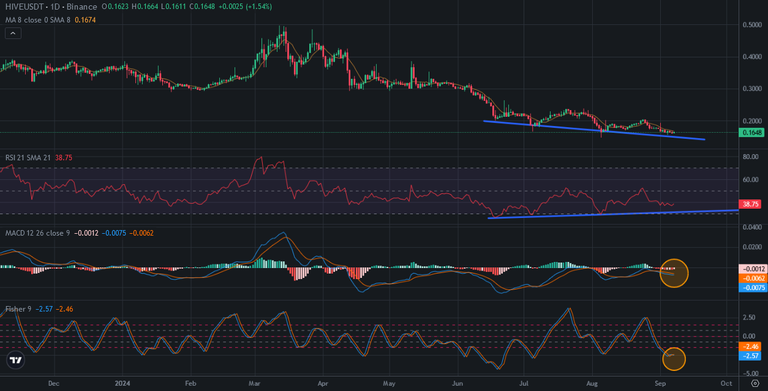
Here you can see the indicators on daily chart of Hive. MACD and Fisher Indicators are on the bottom and waiting for reversing. All of indicators seems bullish on Hive price chart. We need only for good news on crypto market. Bitcoin price drop effect Hive price and Hive is speding the time being as stable at 0,16x USD while market goes down..
As I said, I have never seen a possitive divergence with 4 bottoms. I can not imagine what will happen after this possitive divergence..
We will see...
Posted Using InLeo Alpha