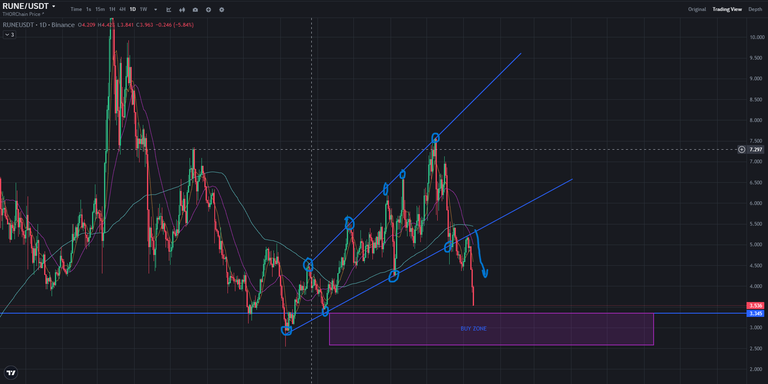
About two days ago RUNE took a dive of the cliff from the $5 zone and is currently trading at around $3..5. I am not quite sure if there was some news that contributed to the downward spike, but here we are.
My trading strategy is all about finding strong zones of support and resistance especially with RUNE. I have found it to be one of the most predictable cryptocurrencies out there, as I have mentioned in the past.

Here on the Daily RUNE/USDT chart, you can observe the higher highs and higher lows that I had plotted a few weeks back looking for opportunities to buy. At some point, price broke below my lower trend line, retested it and then price broke further down quite intensely.
The bears have pilled on, so I am looking for my next area of support and see how price behaves. In this case I am looking at the $3.5 - $2.5 zone. My rationale for this is that this zone was a strong support zone.

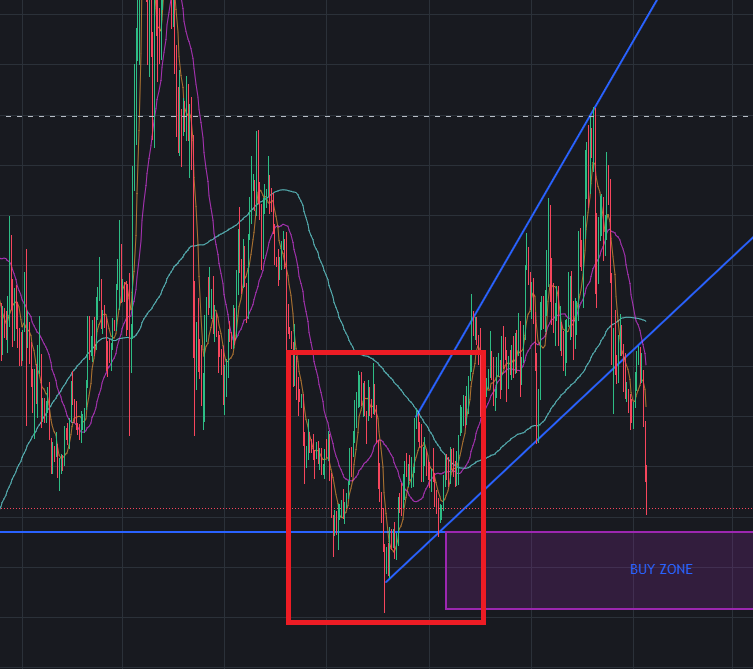
The head and shoulders pattern is one of the most powerful trading signals, and depending on whether it creates peaks or troughs, it can indicate a bearish or bullish signal respectively.
In this case, it created a trough and thus was bullish. Considering this is on the Daily chart, this support zone will be crucial for my next trade. Let's see how price behaves in the coming days.
Posted Using INLEO