Unbelievable how fast time is passing. Here we are, it's Sunday again and it's time for another analysis on $HIVE. It's been a very busy week for me, tiring as well as I've been trading, but I wouldn't have it any other way. I had an amazing experience overall, nailed many good trades and that's all that matters. Anyway, let's see what our dear token has been doing lately.
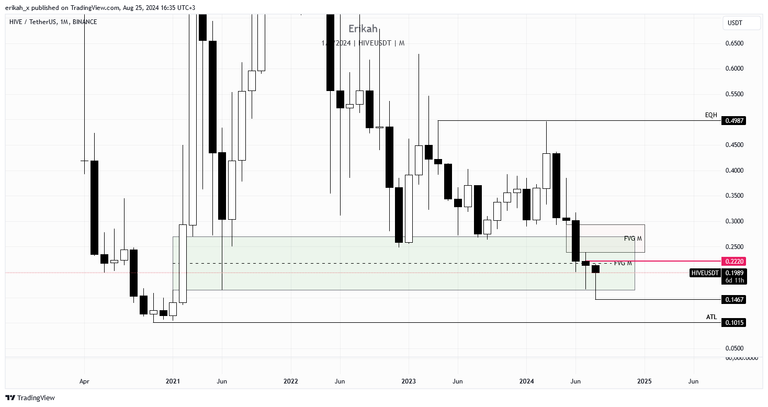
There's one week, or six days left of the month and comparing today's monthly chart with the one I did last week, not much has happened. The candle printed so far is still bearish, but at least has a longer downside wick, which indicates that buyers have stepped in. In order for this candle to turn bullish, his candle should close above $0.222 and hold that level at the end of the month and print a bullish engulfing candle. Is it possible? Anything is possible, especially in crypto, but it depends heavily on what $BTC is going to do next week.
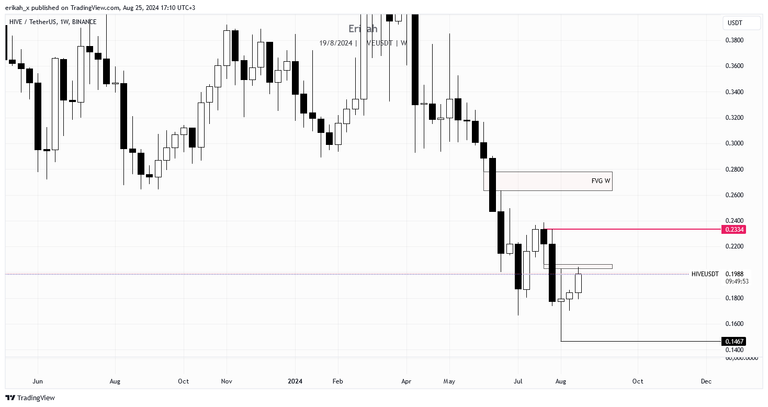
The weekly chart looks more promising in my eyes. Even though we don't have a change in state of delivery yet (CISD), price started printing bullish candles. Right now that skinny, bearish fair value gap (FVG), marked with red on the chart is capping the market. Price needs to rebalance that gap, flip it to support and then continue higher and eventually close above the pink line, at $0.2334, then we have a (CISD) and can continue higher.
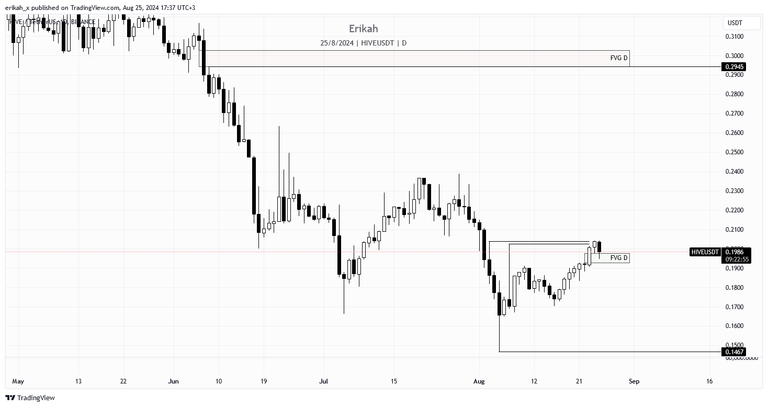
The daily chart is actually looking good. I like what I see, even though this morning was a bit rough for alts. At the time of writing, $HIVE is down 2.5%, but this is nothing, compared some alts, that are down 6%. $HIVE is not a liquid asset, there's no perpetual futures to trade, which means leverage does not play any role in price action, no cascade liquidation, so unless a big player with considerable financial possibility and will, you see a balanced price action, like on the chart above.
At the moment of writing, price came back to retest the bullish FVG (green on the chart), which is currently holding price nicely. If this FVG succeeds in holding price, the upside looks lovely. Up until $0.2945, there's not much to stop price. Obviously I'm not saying price will sky rocket there, it takes time to reach that level, but it's going to happen, sooner, than later. We call that low resistance liquidity run (LRLR), which is an ICT concept. I would long this with leverage.
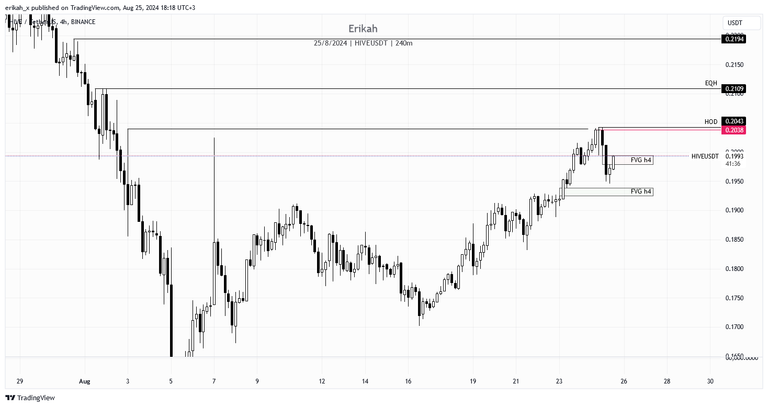
On a more granular scale, the h4 chart looks good to me, even though today we had two bearish candles printed. I'm not sure if this bleeding today can be attributed to Pavel Durov's arrest (CEO of Telegram), but at the end of the day, it doesn't matter. What matters is proper risk management and you're fine.
At the moment of writing, price is rebalancing the bearish FVG (marked with red). There are around 40 minutes till the h4 candle closes, but if it closes above the FVG, the next liquidity pool is above the pink line, at $0.2038. In case price fails to close above the bearish FVG, chances are it's going to retest the green box below, which is a bullish FVG and it is meant to hold price. At this point it doesn't look like that is going to happen, but his is a game of probability, you never know.
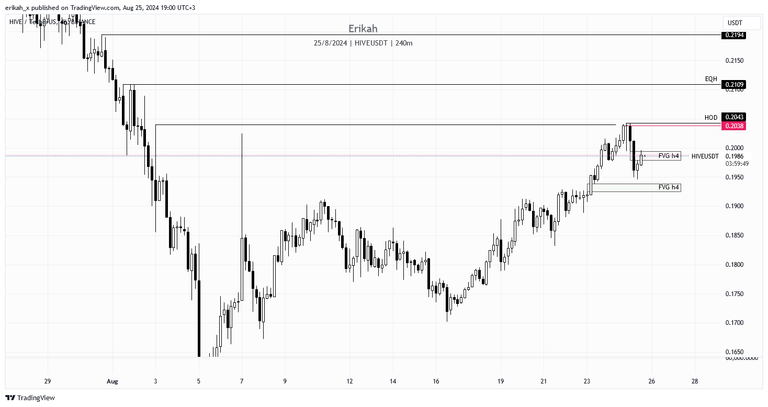
I got to step away from my laptop and in the meantime, the h4 candle closed. Unfortunately it closed inside the FVG, which means we have to wait for the next one, to flip it bullish, as this one failed. No worries though as there is no momentum, being Sunday, there's no volatility.
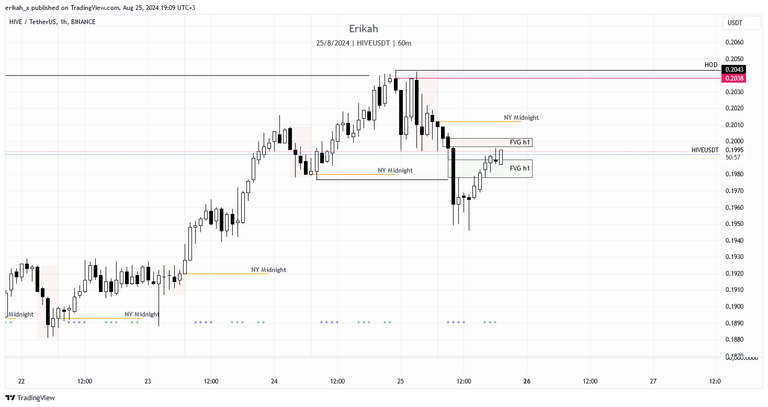
H1 chart looks really nice. I can see some momentum, which can flip the bearish FVG hopefully and from there, the next liquidity pool is the above the wick at $0.2043, which is relative equal high as well, which is known as drawing liquidity.
I must admit, price action of $HIVE is looking good and a nice upside continuation can happen, but we're not out of the woods yet. It wasn't my intention to chart $BTC, but there are concern, so here it is.
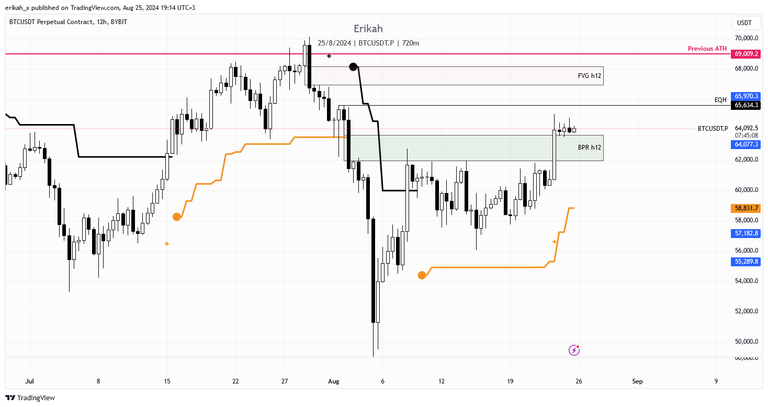
This is the H12 chart on $BTC. So far, price is holding nicely for two days in a row, after the nice expansion we had on the 23th. This is good, but the FVG below is known as internal liquidity and there's a chance price could come back to rebalance it. I don't want to complicate it with mentioning BPR and so on, but if a rebalancing attempt will happen, it's going to affect $HIVE as well. Time will tell.
My BPro indicator printed a bullish signal on the 23th, which will hold even if $BTC rebalances the gap, but alts will suffer.
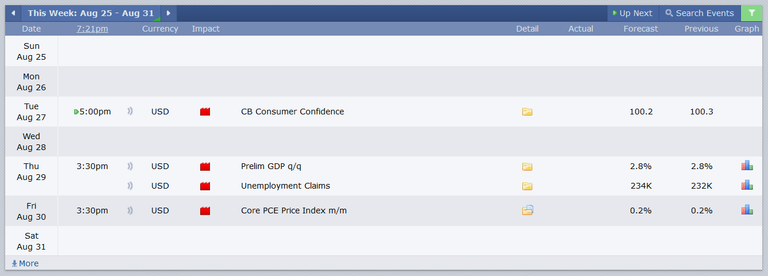
In terms of news, next week we have three red folder news days, which means volatility and manipulation as well. I don't mind these days as it makes trading more interesting, but dangerous too. Let's see what these days can bring us.
As always, this is a game of probabilities, not certainties. Also please note, this is not financial advice, it's my view and understanding of the market.
All charts posted here are screenshots from Tradinview.

If you're a newbie, you may want to check out these guides:
- Communities Explained - Newbie Guide
- Cross Posting And Reposting Explained, Using PeakD
- Hive Is Not For Me
- How To Pump Your Reputation Fast - Newbie Guide
- Tips And Tricks & Useful Hive Tools For Newbies
- More Useful Tools On Hive - Newbie Guide
- Community List And Why It Is Important To Post In The Right Community
- Witnesses And Proposals Explained - Newbie Guide
- To Stake, Or Not To Stake - Newbie Guide
- Tags And Tagging - Newbie Guide
- Newbie Expectations And Reality
- About Dust Vote And Hive Reward Pool, by libertycrypto27

