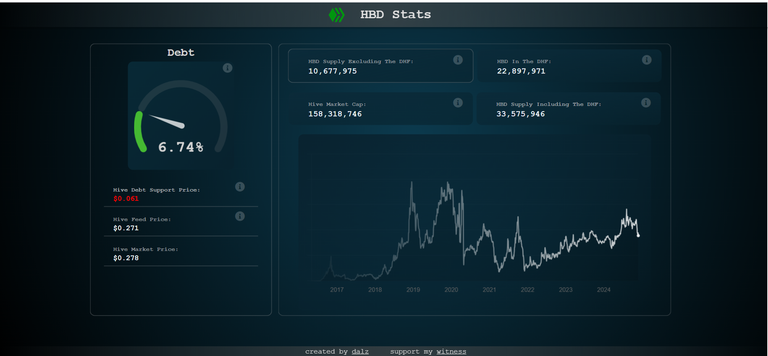
Time to write an article for this day. After visiting @sacrosanct's two 2020 posts and @dalz' site, I want to share my reflection on key insights from Hive's tokenomics, including its declining inflation rate, virtual supply dynamics, rare opportunities for early adopters, and recent trends in HBD and HIVE market performance.
Here's the link to @sacrosanct's posts:
How do reward per Block in Hive changes (or reduces) every year
Does Hive Blockchain print lesser HIVE tokens when HIVE token trades higher?
I don't pretend to understand the meaning of all the numbers in the above posts. In this article, I want to reflect on four interesting insights from the first post. AI gave us an overview of the second article:
It discusses how the number of new HIVE tokens minted decreases as the HIVE token price rises due to a decrease in the HBD/HIVE ratio, impacting virtual supply and inflation rates.
As for the quick recap of the first article, here's how AI summarized it:
It explains how the reward per block in Hive changes over time, similar to how Bitcoin halving occurs every 4 years, with a detailed breakdown of the process and projections for the future.
The four insights I would like to reflect on include the HIVE inflation rate, its virtual supply, price, and the rare opportunity that Hive offers us.
Inflation Rate
In 2020, the blogger mentioned that Hive's inflation rate was 8.05%. After four years, it is now 6.37%. In 2036, it will go down to 1.33% until it settles at 0.95% by 2037. From that time on, the inflation rate will become constant.
I find such an insight interesting. My mind turns instinctively thinking about the impact of that constant inflation rate on the price of HIVE. I am not sure to what extent the idea of inflation in conventional finance applies to cryptocurrency. There is this idea that considers inflation as "hidden taxation" and is harmful to the economy. Some think that inflation is good provided that the additional money supply corresponds to the growth of products and services and thereby will facilitate economic activity and growth.
In Hive's case, if the first view on inflation is correct, then that would mean that as years pass, the reduction in the inflation rate is beneficial to Hive's ecosystem, especially beginning in 2037 when the inflation rate turns constant. That's the dream of many anti-inflation economists in conventional finance.
HIVE's Virtual Supply and Price
If you check the table from the above post, you can see that the inflation rate affects HIVE's virtual supply. Though the inflation rate goes down through the years and makes the production of new tokens not as huge as the previous inflation rate, HIVE's virtual supply keeps increasing. The good thing is that if the price of HIVE appreciates, the writer thinks that it will offset the token's virtual supply.
Opportunity
The tokenomics of Hive provides both content creators and content curators with a rare opportunity. We only have five years left. If the blogger's analysis is correct, beginning in 2029, "the block reward will reduce substantially." This is very advantageous for early adopters.
HBD Statistics

Since the beginning of 2024, I started monitoring HBD's statistics. I observe that the total supply of HBD keeps increasing until 12 June 2024. When I checked my table on 22 August, I observed that the supply has kept declining since then. I don't know the meaning and implication of such a decline, whether it's good or bad.
Another observation has something to do with HIVE's market cap. It peaked at 218,974,837 on 11 March 2024. It declined the following month to 168,903,426 and bounced back to 175,318,668 on 12 May 2024. Since then until 22 August, HIVE's market cap has kept dropping, and I think it found its base at 117,430,434. Beginning last month, it started picking up again and is now back at 158,318, 746.
| Date | HBD Supply Excluding the DHF | HBD in the DHF | HBD Supply Including the DHF | HIVE Market Cap |
|---|---|---|---|---|
| 23 January 2024 | 11,286,398 | 22,483,317 | 33,769,715 | 167,711,212 |
| 22 February | 11,455,539 | 22,659,903 | 34,115,442 | 176,368,744 |
| 11 March | 11,620,371 | 22,757,670 | 34,378,041 | 218,974,837 |
| 18 April | 11,910,811 | 22,813,038 | 34,723,849 | 168,903,426 |
| 12 May | 11,959,165 | 22,996,844 | 34,956,008 | 175,318,668 |
| 12 June | 12,320990 | 22,892,630 | 35,213,620 | 157,780,406 |
| 22 August | 10,923,702 | 22,985,288 | 33,908,990 | 117,430,434 |
| 21 October | 10,941,465 | 22,858,153 | 33,799,649 | 124,270,387 |
| 26 November | 10,677,975 | 22,897,971 | 33,575,946 | 158,318,746 |
Based on the above chart, we can make additional observations. I suspect that the decrease in HBD supply that began on 22 August is a consequence of the reduction of HBD's APR from 20% to 15%. I think I am not alone. Many Hivians either converted their HBD back to HIVE or used it somewhere else.
My final observation is that the increase in HIVE's market cap seems to correspond with the changing general sentiment in cryptocurrency. Though for me, the change in BTC's market trend started way back in February 2023, the talk about bulls returning to cryptocurrency has recently been fueled by the outcome of the American election. At that time, I agree with Dan Morehead, the CEO of Pantera Capital, claiming that the bull cycle in Bitcoin has already returned.
Unfortunately, alt coins, particularly HIVE, have still a long way to go to recover its November 2021 price. Many are even in doubt if HIVE would even revisit that ATH. Though the crypto market has been celebrating the bullish run, in the case of HIVE, looking at its weekly chart, we could say that the price remains flat and still in the consolidation stage and has to pick up the bullish wind.
Posted Using InLeo Alpha
 )
)