The HBD in the DHF keeps growing increasing its impact on the overall hive tokenomics.
Why this matters?
Few things actually, the virtual supply, the hive market cap, the debt, and the hive inflation!
Overall, it has a big impact. Lets go trough the main points here and discuss it a bit.
The HBD in the DHF is already excluded from the debt calculations, but not excluded from the virtual supply. The HBD in the DHF is not available freely on the market until it leaves the @hive.fund account. The impact on the debt is huge and if it was included, we will already be above the debt limit and the blockchain will value HBD less than a dollar.
This was recognized early on and was fixed. But the HBD in the DHF still remains as a part of the virtual hive supply.
This is a pro when it comes to calculating the hive market cap and ranking it on the coins aggregators like coinmarket cap (CMC) and coingecko. Although coingecko is not working with the hive virtual supply when calculating the market cap and because of this the hive rankings on CMC and coingecko are different. I'm not totally sure how coingecko takes the supply for hive.
Inflation
This is where the HBD in the DHF has a real impact on hive tokenomics. In terms of percent there is no impact, but it has in the absolute numbers for new hive issued.
Here is the formula for new hive created per block:
new_hive = ( ( virtual_supply * current_inflation_rate ) / ( 10000 * BLOCKS_PER_YEAR ) )*100
As mentioned the above is HIVE per block. To get the daily amount we multiply this with the numbers of blocks in a day, 28800. One Hive block is created every three seconds. This number can vary slightly depending on how many blocks were actually created in the day but is around that number.
As we can see the new hive entering circulation is a function from the inflation in percentage and the virtual supply.
The virtual supply is a base for calculating the absolute hive inflation. Now the thing is, the virtual supply is changing and fluctuating a lot depending on the hive price. A reminder that the virtual supply is a sum of the hive supply and the HBD supply converted to hive at the current feed price for hive. When the hive price drops the amount of hive that can be converted from HBD increases and the opposite, when the hive price increases the amount of hive that can be converted from HBD decreases.
Here is the chart for the virtual supply in the last period.
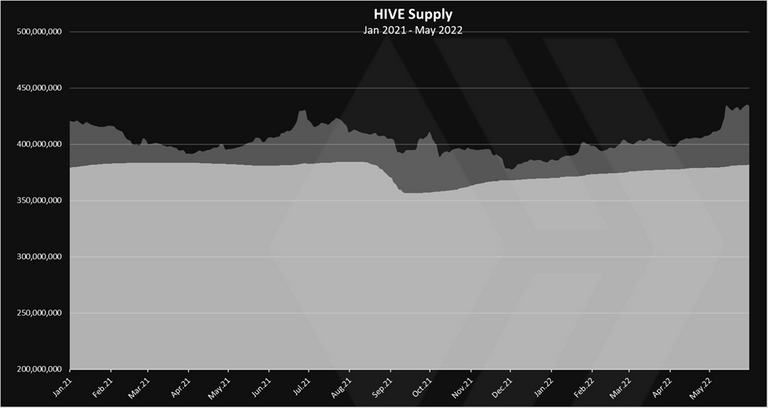
The chart above includes the base HIVE supply and the virtual one from HBD added on the top with the light color. The lowest the total HIVE supply has been is December 1st with around 377M HIVE in total, while the highest is these days reaching 450M at one point.
Going from 377M to 450M in six months. This is almost a 20% change in the supply. Meanwhile in the same period the actual hive supply has increased from 368M to 385M, or a 4.6% increase. Quite the difference between the two types of supply. Note that the numbers are max and min and they can change fast, especially for the virtual supply.
The virtual hive supply from HBD only chart looks like this.
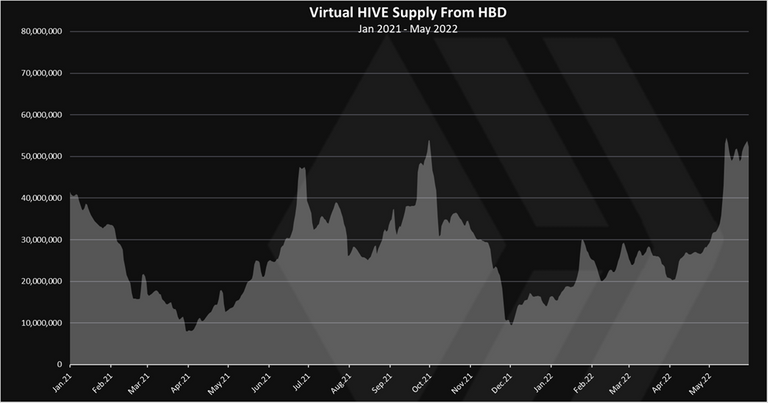
We can see that it oscillate a lot with the numbers as low as 10M HIVE only in April and December 2021 and more than 60M these days. A six time change in the supply in the short period of time.
How does the virtual hive supply affect inflation?
If we take a look at the daily hive created in absolute numbers at the top and the bottom of the virtual supply from the above we get this.
• December 1st 2021 – 76k HIVE daily
• June 21st, 2022 – 88k HIVE daily
Note that this is HIVE equivalent, because not all the HIVE is paid as HIVE but DHF and 50% of the authors rewards are paid in HBD. The HIVE inflation only is 56k and 65k, min and max.
The change from 76k to 88k is an increase of 16% in the HIVE inflation.
This change is only because of the change of the base, the virtual hive supply. The percent for the HIVE supply in the period has actually went down from 7.4% to 7.2% so it has helped a bit.
A 16% change in the inflation is not a small number at all. If we consider that out of the 24.6M HBD in total, 16.8M is in the DHF, that accounts for 68% of the HBD supply, and the same impact in this additional inflation.
If the HBD in the DHF was excluded from the virtual supply, on June 21, 2022 we will have a total of 407M virtual HIVE supply, instead of the 450M. With the base of 407M virtual hive supply, the daily hive inflation will be 80k instead of the 88k. A reduction in the absolute hive inflation of 8k per day, 240k per month and 2.8M per year. Now the monthly and the yearly numbers will be a bit different, since the hive price will be changing all the time and so does the virtual supply, but it is a good example to show of how much additional inflation the HBD in the DHF adds.
The HBD in the DHF will keep growing and so does its impact
As already mentioned, the HBD in the DHF keeps growing. A one year ago the HBD balance in the DHF was at 4M HBD. Now is almost 17M. A 13M added in a year.
There are multiple source now that adds HBD. The conversion of the ninja mined hive in HBD has been dominant in the last two years. This will continue for three more years as there is still 61M HIVE in the DHF. The @hbdstabilizer has also been growing the DHF adding more than 1M. At the end there is the regular inflation, a 10% share of it, that goes towards the DHF.
Even as it is now the impact from the HBD in the DHF is already significant.
When this amount double and triples in a few years time so will the impact on inflation. The HBD in the DHF will probably reach more than 50M HBD in three years time. Imagen the absolute hive inflation changing double because of it. For example, instead of 40k hive per day we get 80k. That is just too much. Again, to point out one more time, the HBD in the DHF is not available freely on the market. Nobody can come and buy it! It can only leave that account when a proposal is approved.
This is the case for the @hbdstabilizer as well, that is now handling massive amounts per day, but only because it is voted from the stakeholders. Even then, only 1% of the DHF is available to be paid per day, again limiting the availability of the HBD in the DHF.
The HBD in the DHF is for sure to grow but the freely available HBD goes up and down
If we take a look at the freely available HBD its supply has been going up and down.
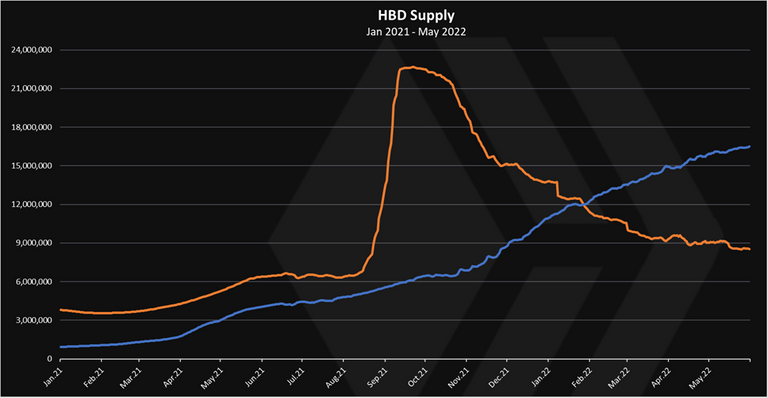
The blue line is the HBD in the DHF, while the orange is the freely available HBD.*
HBD on the open market is adjusting its supply according to the market conditions. When the price of hive goes up so does the HBD supply and the opposite. What this means is that the freely available HBD can have limited impact on the virtual supply, unlike the HBD in the DHF that is guaranteed to increase in supply as time progresses and it will keep increasing its impact on the virtual supply and the hive inflation.
The regular HIVE inflation will continue to decrease, both in percent and in absolute numbers
First the inflation in percentage term.
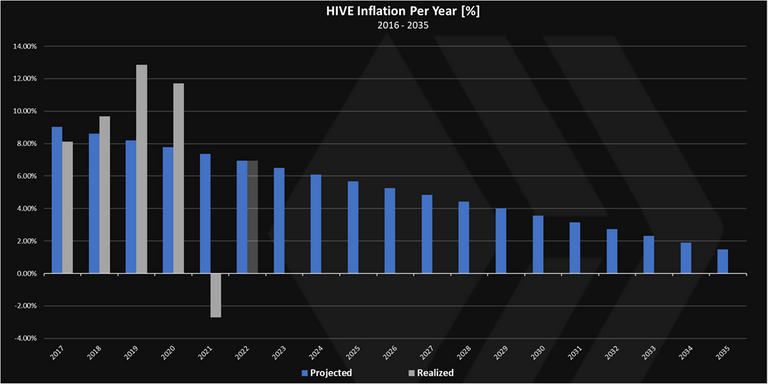
This chart is mostly know, as the inflation is set to go down 0.5% each year, reaching 1.5% in 2035 and stays at that level.
The numbers here keeps going down.
The chart in absolute HIVE numbers looks like this.
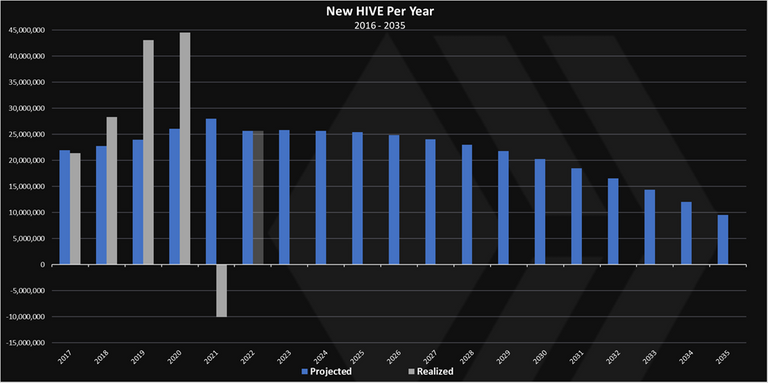
In absolute numbers, the hive inflation goes up until 2021 to 27M, and then it keeps decreasing to 10M In 2035.
The HBD <-> HIVE conversions are distorting the regular inflation this data as we have seen from the past, and from the monthly reports on the HIVE inflation.
Final thoughts
From all the above it seems that it is better to exclude the HBD in the DHF from the virtual hive supply as it has been done for the debt. The con is that this can decrease the hive market cap, but as we can see one of the aggregators is already doing its own calculations. This is of a small importance and only a temporary thing as crypto prices are so volatile, 10% less supply or so, doesn’t count as much. On the other hand, we will be stabilizing the inflation further and improving an important metric the hive tokenomics.
Any discussions and thoughts are welcomed in the comments.
All the best
@dalz
