Hi Everyone,

Welcome to the eighth post in my conference and journal paper post series. This series will contain ten conference and journal papers from my time working in the Queensland Government. In my post, My Peer Reviewed Conference and Journal Papers, I explain the purpose of this series.
At the end of 2013, I gave a brief presentation at the Low Volume Roads Symposium in Cairns. I only needed to provide an abstract of a paper and not a full paper. The presentation went well and was well received. Since I had already done much of the research, I decided to write a full paper on the contents of my presentation. This paper was titled Upgrading Rural Bridges for Improved Freight Efficiency.
In 2014, I was travelling back to the UK to visit my mum. At that time, the European Transport Conference was being held in Frankfurt, Germany. I thought this would be an ideal opportunity to present my paper at this conference. I would also be able to claim some of my expenses on tax. The paper was accepted without a problem.
Australia has some of the largest freight vehicles in the world. These vehicles are called multi-combination vehicles, or more commonly, road trains. They are incredibly long and heavy. Not every road is designed to carry these vehicles. Bridges need to be reinforced to enable them to cross. Corners need to be sufficiently gentle to enable them to turn. Not all roads meet these requirements. Therefore, companies either use smaller freight vehicles or take alternative routes to reach destinations.
The Government can intervene by upgrading roads to enable larger vehicles to use them. Are these upgrades worth the costs? This paper offers a methodology to evaluate current practices as well as projects that upgrade certain roads. Almost all the proposed projects are on rural roads with traffic volumes.
The methodology presented in the paper was a little similar to the flood immunity methodology that I presented several years earlier. It involved comparing the costs of travelling along different routes. This paper was a little more relevant to Europe, which also transports a high percentage of freight by road.
UPGRADING RURAL BRIDGES FOR IMPROVED FREIGHT EFFICIENCY
Abstract
This paper focuses on the methods and approaches of evaluating the benefits of upgrading bridges that are currently structurally deficient to carry vehicles above certain tonnage or do not cater for certain heavy vehicle dimensions. Many of these bridges are located in rural areas where traffic volumes tend to be low. Benefits for most road projects are driven by traffic volume. If a project has high capital costs and low traffic volumes, a cost benefit analysis (CBA) would normally imply the project is not economically viable.
The extent traffic volume is a causation of benefits for bridge upgrades is not as obvious as for other road project types. In this paper, the key determinants for deriving benefits for these bridge upgrades are discussed in some detail. These key determinants include the number of heavy vehicles, extent of restrictions (tonnage, size and length), length of diversion route required by heavy vehicles to avoid load and size restricted bridge/s, total distance heavy vehicles are required to travel to reach their destination and the maintenance costs required if the bridge is not upgraded.
In this paper, three approaches of evaluating benefits of upgrades to bridges are discussed. These approaches centre on the behaviour of heavy vehicle road users when a bridge can no longer be traversed due to structural deficiencies. First approach assumes heavy vehicle road users will divert to avoid the bridge, second approach assumes heavy road users will switch to smaller vehicles that are within the load restrictions of the bridge and the third approach is a hybrid of the first two approaches. To demonstrate the above-mentioned approaches, two case studies from Queensland Australia have been included in the paper.
1. INTRODUCTION
Traffic volume is often the key determinant in the calculation of benefits for road infrastructure projects. Rural roads in Queensland, Australia often have low volumes of traffic. The cost benefit analysis (CBA) is a key input into the decision to fund road upgrades (Infrastructure Australia 2013). Projects are often not funded, if the estimated discounted benefits do not exceed the estimated discounted costs of the project. The benefits of rural bridge upgrades are less sensitive to traffic volume than most other road infrastructure projects. This paper investigates other key determinants of benefits for rural bridges and proposes three approaches to evaluate benefits using these other key determinants.
Typical rural bridge upgrades, in Queensland, involve strengthening and reinforcing bridges to maintain or increase load limits, realigning approaches or widening bridges to allow longer multi-combination vehicles, or provide upgrades to improve the flood immunity of the bridge. Some upgrades aim to address all the above mentioned objectives. This paper focuses on the strengthening and reinforcing bridges to maintain or increase load limits. The approaches discussed can also be applied to realigning and widening bridges. Improving flood immunity is beyond the scope of this paper and requires quite a different approach than the ones suggested in this paper. It is possible that the approaches described in this paper can be combined with a flood immunity approach.
2. RELATIONSHIP BETWEEN BENEFITS AND TRAFFIC VOLUME
Road user costs11 increase proportionately to increases in traffic volume until the road shows signs of congestion, once this happens, road user costs increase at an increasing rate. The volume capacity ratio (VCR) measures the relationship between the traffic volume and road capacity. The traffic volume is often measured in passenger car units (PCU) and road capacity is determined by the model road state (MRS) of the road (TMR 2011). PCUs factor the impact vehicles have on congestion, which is measured in car equivalents. Cars are equivalent to one PCU, while other larger vehicles have a PCU greater than one. PCU is also influenced by the gradient of the road, the steepness of the road and the PCU per vehicle are directly related, this is especially true for larger heavy vehicles (Arkatkar and Arasan 2010). MRS is determined by the width and the number of carriageways of the road. Operating speed is assumed unhindered by other traffic on the road until a particular VCR is reached, for motorways this VCR is 0.4, for other roads with less lanes this value is much lower (Austroads 2005). Speed is assumed to gradually decrease until the VCR is 1, VCRs of greater than 1 are expected to cause operating speeds to drop dramatically and hence the road user costs to increase dramatically. New infrastructure that increases capacity so that the VCR falls back below 1 will have very high road user cost savings (benefits). This relationship is presented in Figure 1.
Figure 1: Relationship between benefits and volume capacity ratio
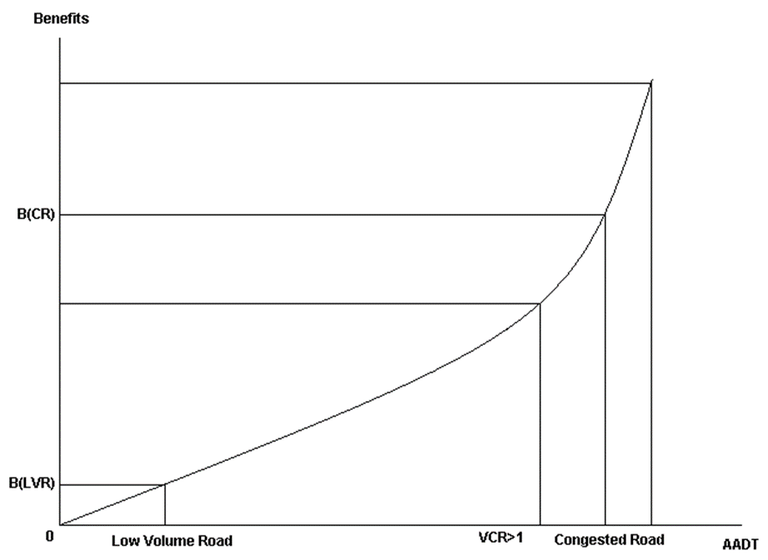
For a low volume road, the VCR will be low in the base case22, hence the benefits will be low. For bridge upgrades, benefits are less dependent on traffic volume and more dependent on other factors. These factors include:
• current and future load limit of the bridge
• costs of maintaining the existing bridge
• the number of vehicles subject to load limits
• the availability and length of alternative routes
• the distance between the origin and destination of vehicles
• the frequency of flooding on the original route33 and alternative routes.
Rural roads often have older infrastructure that cannot handle new larger vehicles or cannot be sufficiently maintained to carry these vehicles; costs of maintaining older bridges to current safety standards is also likely to be high (Frangopol et al., 1997). Alternative routes are often long and of poor standard. These routes may also have infrastructure that will eventually require load restrictions. Rural roads tend to have a high percentage of heavy vehicles compared to higher volume roads (Australasian College of Road Safety 2012). Upgrading to cater for heavy vehicles will have minimal benefits for light vehicles. Light vehicles may even experience dis-benefits if the heavy vehicles cause disruption to the traffic flow along the original route. Flooding, particularly in Queensland, may cause closures across the network. This will affect both the bridge proposed to be upgraded as well as the possible alternative routes.
3. PROPOSED SOLUTIONS
This paper proposes three approaches to evaluate the benefits for upgrading rural bridges. These approaches are:
• ‘divert to avoid the bridge’ approach
• ‘use of smaller vehicles’ approach
• combination of ‘divert to avoid the bridge’ and ‘use of smaller vehicles’ approaches.
If a bridge is currently load restricted, information can be obtained regarding the behaviour of the heavy vehicle users. With this information, one of the three approaches can be applied. If the bridge is not expected to be load restricted for a few more years, heavy vehicle road user behaviour needs to be anticipated. This road user behaviour can be ascertained in a number of ways. If the time and budget exists, a survey of anticipated heavy vehicles operators likely to be affected can be conducted. If a survey is not possible, data from other similar project sites where load limits have been implemented can be collected.
The approaches suggested in this paper focus purely around evaluating reductions in road user costs. Reductions in transport agency costs is unaffected by the proposed approaches, therefore is not discussed under any of the approaches.
3.1. Diverting to avoid bridge
The ‘diverting to avoid bridge’ approach is built around the premise that operators of vehicles which are in excess of the load limits will divert to avoid the load limited bridge. This approach requires information regarding viable diversion routes. Origin-destination information of heavy vehicles would be a useful input to determine which routes are more likely to be utilised. If the distance between the origin and destination is long, a longer diversion route may be a more desirable alternative if the net additional distance travelled is shorter. Figure 2 illustrates the possible types of diversion routes that might be available to operators of vehicles in excess of load limits.
Figure 2: Selection of Diversion Routes Dependent on Destination

Heavy vehicles travelling between A and B only have the option of taking diversion route WX to avoid the load restricted bridge. Heavy vehicles travelling between A and C can choose between diversion routes WX or YZ. If the distance between A and C is 400km and the distance of AYZC is 520km and the distance of AWXC is 580km, heavy vehicle users can be assumed to choose the YZ diversion route if the quality and operating speeds of YZ is very similar to AC. If YZ is of a lower quality and operating speeds are lower, diversion route WX may still be selected. The road user cost savings can be calculated by subtracting the costs of travelling along the original route from the costs of taking a diversion route for the section of the original route not travelled when the diversion route is taken44. These savings are multiplied by the number of heavy vehicles affected by the load restrictions and an annualisation factor to determine the cost savings for the year. This relationship is expressed in Equation 1.
Equation 1
(RUCDR × SLDR - RUCOR × SLOR) × HVALR × AF
Where:
RUCDR/OR = Road user costs for smaller and larger freight vehicles
HVALR = Number of heavy vehicles using the diversion route
SLDR/OR = Section length of the diversion route and original route for the section of the original route not travelled when the diversion route is taken
AF = Annualisation factor (365 days is normally used for rural roads)
Light vehicle users on both the original route and diversion routes may also be affected. Light vehicle users on the diversion route will benefit from the reduction in heavy vehicles while light vehicle users on the original route may dis-benefit from more heavy vehicles but benefit from a safer bridge. These benefits and dis-benefits are expected to be low considering the low traffic volume. The use of the shorter route when the bridge is not load limited will reduce externality costs such as emissions from vehicles55, these benefits can be calculated using a formula similar to that presented in Equation 1.
3.2. Use of smaller vehicles
The ‘use of smaller vehicle’ approach is built around the premise that operators of vehicles in excess of the load limits will switch to smaller lighter vehicles. The use of smaller vehicles becomes a possible scenario to analyse if distances between the origin and destination is short or if diversion routes are not viable. If it is assumed that the volume of freight transported is unaffected by the use of small vehicles, the number of vehicles used to transport freight will be higher while load restrictions are in place. An assumption needs to be made regarding how many smaller vehicles are required to carry the freight volume of the larger load restricted vehicles. The Transport and Main Roads Cost-benefit Analysis Manual recommends adopting a conversion factor based on mass limits of heavy vehicles66.
The road user cost savings can be calculated by subtracting the cost of operating larger vehicles to transport the freight from the cost of operating smaller vehicles to transport the same quantity of freight, the savings are multiplied by the distance and an annualisation factor. This relationship is expressed in Equation 2.
Equation 2
(RUCT1 × HVT1 - RUCT2 × HVT2) × SL × AF
Where:
RUCT1/T2 = Road user costs for smaller and larger freight vehicles
HVT1/T2 = Number of smaller and larger freight vehicles
SL =Section length or average distance travelled by vehicles
The distance travelled will remain the same and the costs per vehicle will be higher but the reduction in the total number of vehicles will produce cost savings.
There is also the possibility that decoupling bays could be located within close proximity of the bridge. If decoupling is a viable alternative, the costs of transporting freight between decoupling bays using smaller vehicles can be used to determine the benefits of upgrading the bridge. Equation 3 contains a possible formula for calculating these costs.
Equation 3
((2 × RUCT1) + RUCPM - RUCT2) × HVT2 × SLBDP × AF
Where:
RUCPM = Road user costs for prime movers
SLBDP = Distance between decoupling bays
Equation 3 applies to type 1 road trains decoupling down to articulated vehicles7. In the base case, the number of trips between decoupling bays is assumed to double and the prime mover is expected to travel back to collect the remaining trailer. This equation can be adapted for other types of heavy vehicles decoupling to small vehicles.
3.3. Combination of diverting and using smaller vehicles
The approaches described above can be combined and applied to the same evaluation. If data exists regarding heavy vehicle operator behaviour, this data can be applied to Equations 1 to 3 and summated to arrive at the total value of road user cost savings. In the absence of data, road user behaviour needs to be predicted. An approach would be to assume heavy vehicle operators select the least cost option. The least cost option can be determined using Equation 4.
Equation 4
Min(RUCDRT2 × SLDR - RUCORT2 × SL|OR), (RUCORT1 × HVT1 ⁄HVT2 - RUCORT2) × SLOR
Obtaining origin-destination data for vehicles is important for this approach to be effective. The costs of switching to smaller vehicles are very sensitive to the distance of the trip. A long distance between the origin and destination will sway heavy vehicle operators to use alternative routes rather than use smaller vehicles.
4. COMPARISON OF APPROACHES
The three approaches discussed have strengths and weaknesses and should not be applied universally to all bridge upgrade projects. The strengths and weaknesses of the proposed approaches are summarized in Tables 1 and 2.
Table 1: Strengths of Proposed Approaches
| Diverting to avoid bridge | Use smaller vehicles | Combination of approaches |
|---|---|---|
| Most data is accessible | Not data intensive | Good for detailed analysis |
| Applicable to most projects | Simple methodology | Applicable to most projects |
| Approach supported by tools | Good for rapid analysis | Considers entire route |
| Incorporates road user behaviour | ||
| Heavy vehicle operator survey data results can be incorporated into approach. |
Table 2: Weaknesses of Proposed Approaches
| Diverting to avoid bridge | Use smaller vehicles | Combination of approaches |
|---|---|---|
| Does not include road user behaviour | Many factors not considered | Very data intensive |
| Complexity of diversion route | Many broad assumptions | Complex methodology |
| Not realistic for many projects | Very time consuming | |
| Relies quite heavily on the availability of origin-destination data | Relies quite heavily on the availability of origin-destination data |
The ‘diverting to avoid bridge’ approach is applicable to most projects as at least one diversion route is normally available. In Queensland, road and traffic data is readily available for most rural roads. Existing CBA models can be used to evaluate projects with this approach as adding diversion routes is an extension of the same methodologies applied to other rural road upgrades. The ‘diverting to avoid bridge’ approach rigidly assumes all vehicles that cannot pass over the bridge will divert, which may not be an accurate representation of reality. Accurate information regarding appropriateness of diversion route may not be available and the diversion routes may change depending on seasonal conditions.
The ‘use of smaller vehicles’ approach is even simpler than the ‘diverting to avoid bridge’ approach as only one route is considered. Vehicle loads per heavy vehicle type are readily available and can be used to determine the number of smaller vehicles required to carry the load of a larger vehicle. The ‘use of smaller vehicles’ approach rigidly assumes that the use of smaller vehicles is the only solution to transporting freight when load restrictions apply. This approach is very dependent on the availability of origin-destination data as the benefits calculated using this approach is very dependent on the distance vehicles are required to travel.
The combination of the two approaches is mostly likely to produce the most accurate calculation of benefits as road user behaviour can be flexibly changed to reflect the costs of transporting freight. The results of such an analysis can be presented in detail. The benefits to various groups of heavy vehicle operators can be clearly outlined. This approach can also incorporate the results of survey data suggesting different responses from different heavy vehicle operators depending on the origin and destination of the freight. Combining the two approaches can be very time consuming and data intensive. Road user behaviour may need to be predicted, such predictions require significant data in order to be accurate. Like the ‘use of smaller vehicles’ approach, this approach relies heavily on origin-destination data for heavy vehicles, this data is often not available.
5. CASE STUDIES
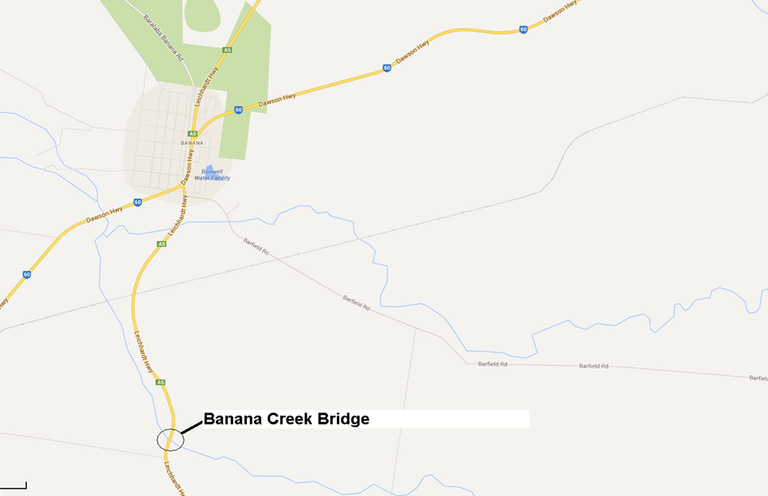
The ‘diverting to avoid bridge’ and ‘use of smaller vehicles’ approaches have been applied to actual projects in Queensland. The ‘diverting to avoid bridge’ approach was applied to the Jingi Jingi Bridge Upgrade. The ‘use of smaller vehicles’ approach has been applied to the Regional Bridge Renewal Program, from this program the Banana Creek Bridge Upgrade has been selected for this paper.
5.1. Jingi Jingi Bridge Upgrade
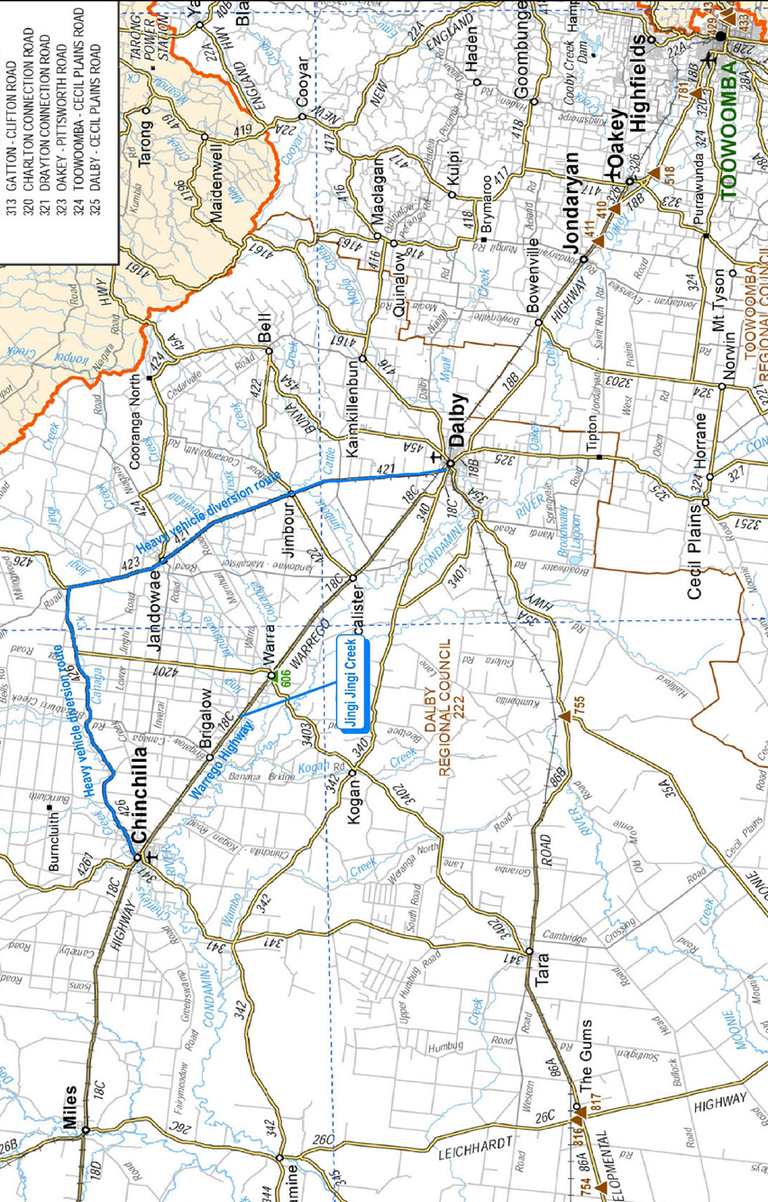
The Jingi Jingi Bridge Upgrade was proposed as part of the Warrego Highway Upgrade (WHU) Program. The bridge is located along the Warrego Highway between the Towns of Dalby and Chinchilla. The existing structure was found to be structurally unsound and is expected to become load restricted within the next 10-15 years as a safety precaution. The ‘diverting to avoid bridge’ approach was selected to evaluate the project due to the long distances most heavy vehicles using this route are likely to travel. This distance can be up to 1700km for heavy vehicles travelling between Cloncurry and Brisbane.
The proposed diversion route between Dalby and Chinchilla is made up of several low-volume roads. These low-volume roads are of lower quality, have curvier alignments, narrower shoulder seals, and lower speed limits. The length of the diversion route is 110km. The original route along the Warrego Highway between Dalby and Chinchilla is 82km, 28km shorter than the diversion route. The map of the diversion route is provided in the Appendix. In 2028, 470 heavy vehicles a day are expected to utilize the diversion route if the Jingi Jingi Bridge is not upgraded.
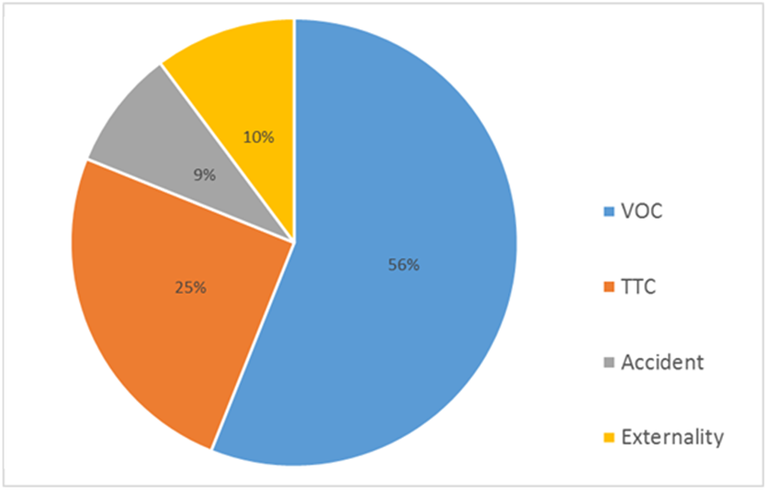
The capital cost of the upgrade is $26.3 million and the upgraded bridge is expected to have a life of 40 years. The evaluation period applied to the project was 32 years (30 years of operation and 2 years of construction), the remaining 10 years of benefits were treated as residual value. The road user cost (RUC) savings included in the evaluation were travel time cost (TTC) savings, vehicle operating cost (VOC) savings, and accident cost savings. The externality cost savings included emission, environmental, and noise reductions. The bridge is also expected to require less maintenance work, hence reducing future maintenance costs.
The Detailed Road Economic Analysis Model (DREAM) was used to evaluate the project. DREAM uses algorithms derived from the National Association of Australian State Road Authorities (NAASRA) Improved Model for Project Assessment and Costing (NIMPAC) to calculate operating speed and the components of VOC such as tyre wear and fuel consumption. DREAM uses Austroads unit values to convert outputs into dollar values. The Austroads unit values are nationally accepted values that are applied to CBA across Australia.
The selected economic indicators used to determine the economic viability and ranking of project within the program were the net present value (NPV), benefit cost ratio (BCR), and net benefit investment ratio (NBIR). The first year rate of return (FYRR), and internal rate of return (IRR) were also reported but were not considered key to the funding recommendation. For the project to be considered economically viable, the BCR and NBIR are required to be greater than one and the NPV greater than zero. The NBIR is also used to rank projects within the program. The NBIR is required to be greater than the NBIR of the lowest project within the program before the allocated funding is exhausted.
The results of the CBA indicate that the Jingi Jingi Bridge Upgrade is economically viable at all of the prescribed discount rates88. The combination of the relatively low capital costs of upgrading the bridge and the high road user costs of heavy vehicles diverting produced a high NPV, BCR, and NBIR. The results are provided in Table 3 and the breakdown of benefits are presented in Figure 3.
Table 3: Results of the Jingi Jingi Bridge CBA
Results| 4% | 6% | 7%
| Total Costs | $18,202,117 | $19,151,653 | $19,407,595
| Capital | $24,699,747 | $23,954,473 | $23,596,162
| Maintenance Costs | -$4,548,782 | -$3,743,427 | -$3,404,119
| Residual Value9 | $1,948,847 | $1,059,393 | $784,448
| Total Benefits | $286,427,661 | $185,417,299 | $150,159,406
| Heavy Vehicle VOC Savings | $161,142,163 | $104,057,707 | $84,175,685
| Heavy Vehicle TTC Savings | $71,055,429 | $46,292,706 | $37,599,225
| Accident Cost Savings | $24,923,977 | $16,115,536 | $13,044,559
| Externality Cost Savings | $29,306,093 | $18,951,349 | $15,339,936
| Net Present Value (NPV) | $268,225,544 | $166,265,646 | $130,751,811
| NPV per Dollar Invested | 10.86 | 6.94 | 5.54
| Net Benefit Investment Ratio | 11.86 | 7.94 | 6.54
| Benefit Cost Ratio (BCR) | 15.74 | 9.68 | 7.74
| First Year Rate of Return | 0% | 0% | 0% |
|
|---|
