In this post I provide a way to inspect a set of players' queue times at once. This is based on a simple python program that fetches battle data from the splinterlands api, and plots the times for battle queue start, opponent found and team submission. In this post, I've censored the player names for the example plots I provide. The purpose of this post is to provide a convenient little tool to look up accounts that you find suspicious.
I recommend also inspecting transactions on the accounts with a hive explorer site like Hivehub
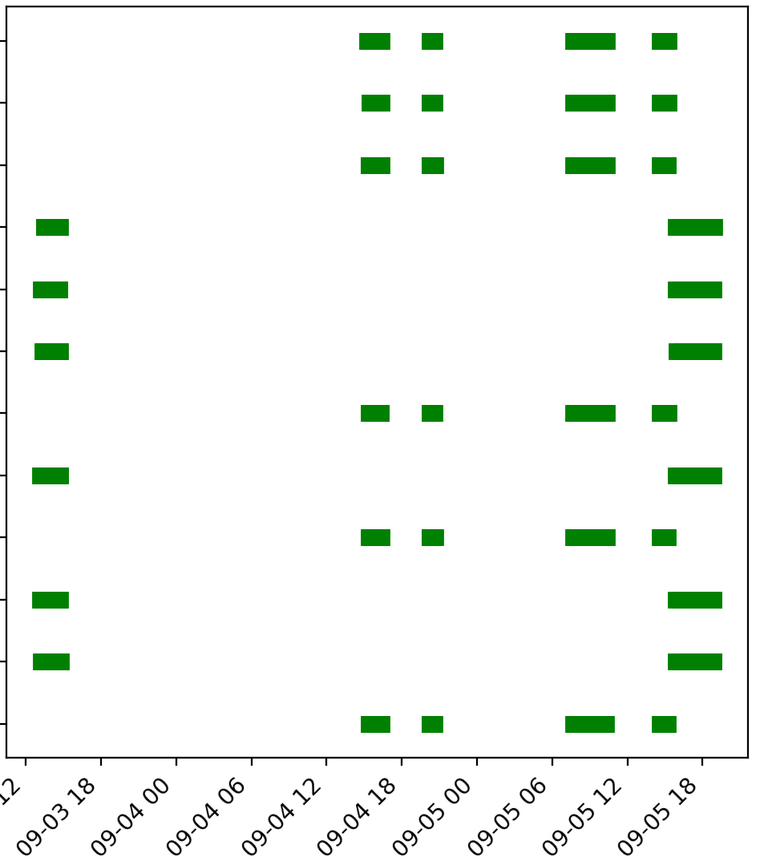
The plot will contain the player names on the left side, and the time points at the bottom axis. So every player's battles will lie on one horizontal line in the plot.
The Python script can be found at the bottom of this post.

Running the script, a result might look like this (Here I've looked at 12 accounts I found to be pretty suspicious):

The script will open this plot in an interactive window where its possible to zoom.
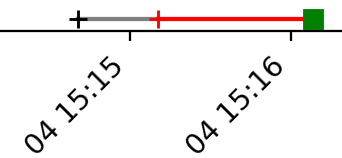
The script is made plot each battle queue time, battle match time and team submission time like this:

The first black plus is the queue time. The grey line is the wait time, and the plus marks when an opponent was found. Then the red line until the green square is the time the user took to generate a team.
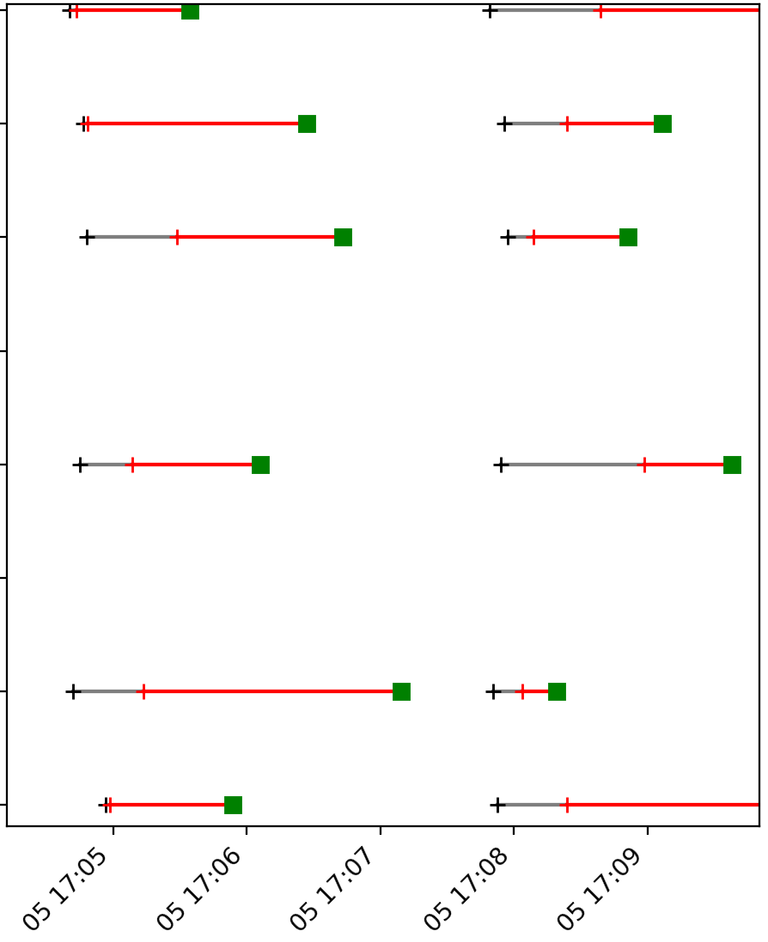
So zooming in to a set of battles here it might look like this:

In this case, this player submits the first five battles within a minute. Thats incredibly fast. Its possible to do, but I dont find it particularly likely that a player can keep this up for extended periods of time.

Python code
import requests,json
import matplotlib.pyplot as plt
import datetime as dt
username = "your_username"
token = "your_token"
players = ["player1", "player2", "etc"] #replace this list with the players you want to inspect.

def getBattleTimes(player):
    dat = requests.get(f"https://api2.splinterlands.com/battle/history?player={player}&username={username}&token={token}&format=modern&limit=50").json()
    # You can remove the "&format=modern" part from the line above if you want more than just modern matches.
    # "&format=wild" will limit it to wild battles.
    qtimes = []
    stimes = []
    mtimes = []
    for b in dat['battles']:
        try:
            p1 = b['player_1']
            p2 = b['player_2']
            if(b['format'] == "modern"):
                qt = json.loads(b['queue_times'])
                p1_qcd = qt['player1_queue_created_date']
                p2_qcd = qt['player2_queue_created_date']
                p1_md = qt['player1_match_date']
                p2_md = qt['player2_match_date']
                p1_sd = qt['player1_submit_date']
                p2_sd = qt['player2_submit_date']
                if(p2 == player):
                    qtimes.append(dt.datetime.fromisoformat(p2_qcd))
                    stimes.append(dt.datetime.fromisoformat(p2_sd))
                    mtimes.append(dt.datetime.fromisoformat(p2_md))
                else:
                    qtimes.append(dt.datetime.fromisoformat(p1_qcd))
                    stimes.append(dt.datetime.fromisoformat(p1_sd))
                    mtimes.append(dt.datetime.fromisoformat(p1_md))
        except:
            pass
    return qtimes, stimes, mtimes

f = plt.figure()
plt.subplots_adjust(left=0.25)
ax = f.add_subplot(1,1,1)

for i,p in enumerate(players):
    qt, st, mt = getBattleTimes(p)
    ax.plot(qt, [i]*len(qt), 'k+')
    for j in range(len(st)):
        ax.plot([qt[j],mt[j]], [i,i], 'C7-', zorder=-1)
        ax.plot([mt[j], st[j]] , [i,i], 'r-+')
        ax.plot(st[j] , i, 'gs')
ax.set_yticks(range(len(players)))
ax.set_yticklabels(players)
plt.xticks(rotation=45, ha="right")
plt.show()

Final words
I hope you found this post interesting. If you have not yet joined Splinterlands please click the referral link below to get started.
Best wishes
@Kalkulus


