Hello friends of $POB, Friends of $HIVE and all others,
here are the:
$POB Statistics for the last week:
The timeframe is from 2023-05-12 to 2023-05-19.
(There are small differences between the figures and the tables, because I used different timeslots. I'm working on that)
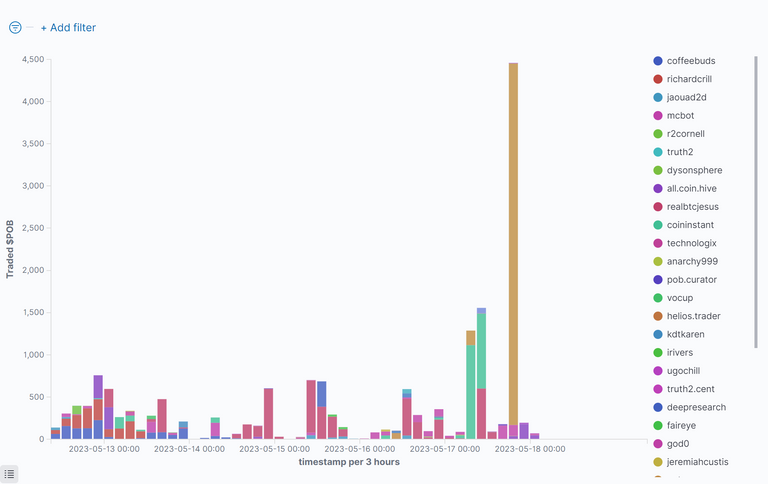
Bought $POB By Time
This figure shows who has bought how many $POB at which time:
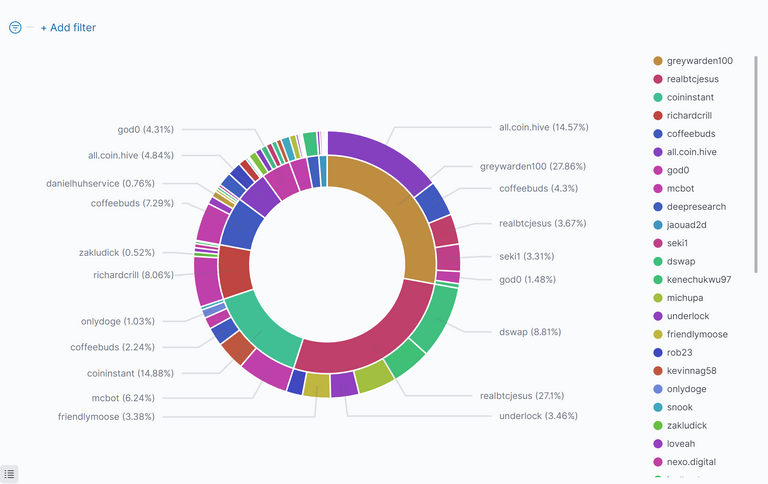
Top $POB Buyers and $HIVE Sellers
The inside of the circle shows the buyers of $POB, ordered by $HIVE they have spent. The outside shows the recipients of that $HIVE (sellers of $POB):
Commulated Amount Of Bought $POB Per Person
This figure shows the top 10 $POB buyers, how much they got and how much $HIVE they spend for this. It is sorted by $HIVE, that was spent:
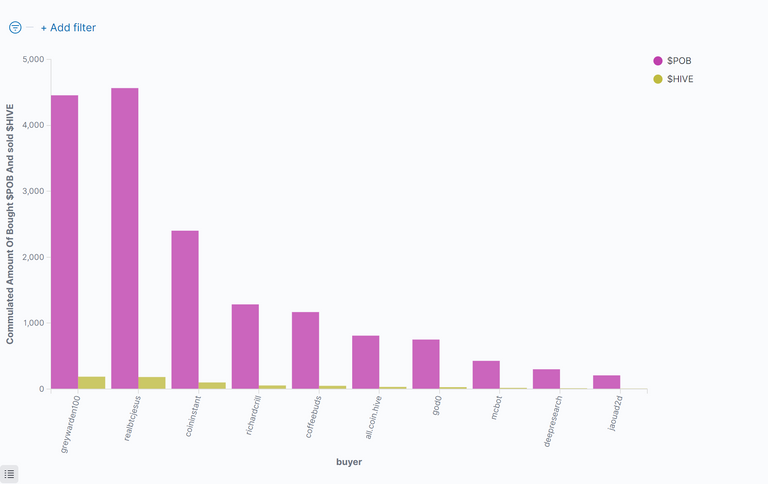
Table Of Top 20 $POB Buyers
This table shows the top ten buyers of $POB sorted by the $HIVE, they have spent:
| Buyer(Descending) | Sold $HIVE | % Sold $HIVE | Bought $POB | Avg. Price | Number of Trades |
|---|---|---|---|---|---|
| @greywarden100 | 187.73915 | 25.27 | 4455.17600 | 0.04133 | 18 |
| @realbtcjesus | 182.63494 | 24.59 | 4564.50547 | 0.04034 | 94 |
| @coininstant | 101.76408 | 13.70 | 2436.78640 | 0.04085 | 40 |
| @richardcrill | 72.54009 | 9.77 | 1707.00728 | 0.04247 | 61 |
| @coffeebuds | 55.63062 | 7.49 | 1319.12363 | 0.04187 | 104 |
| @all.coin.hive | 33.05904 | 4.45 | 820.54717 | 0.04028 | 23 |
| @god0 | 29.01769 | 3.91 | 750.64654 | 0.03869 | 101 |
| @mcbot | 24.66220 | 3.32 | 587.72512 | 0.04194 | 24 |
| @jaouad2d | 12.55755 | 1.69 | 307.52693 | 0.04039 | 30 |
| @deepresearch | 12.00030 | 1.62 | 300.00000 | 0.04000 | 4 |
| @r2cornell | 4.23001 | 0.57 | 100.00000 | 0.04230 | 2 |
| @technologix | 3.42506 | 0.46 | 82.83409 | 0.04099 | 15 |
| @kdtkaren | 3.06213 | 0.41 | 72.90776 | 0.04200 | 5 |
| @soonlambo | 3.01972 | 0.41 | 77.42688 | 0.03900 | 8 |
| @pob.macro | 3.00976 | 0.41 | 72.09015 | 0.04175 | 2 |
| @onlydoge | 2.40293 | 0.32 | 62.73814 | 0.03830 | 1 |
| @faireye | 2.00000 | 0.27 | 50.70296 | 0.03936 | 5 |
| @centtoken | 1.95000 | 0.26 | 50.00000 | 0.03900 | 1 |
| @vocup | 1.65202 | 0.22 | 40.00000 | 0.04130 | 1 |
| @anarchy999 | 1.12016 | 0.15 | 26.87117 | 0.04173 | 5 |
| others | 5.32193 | 0.72 | 130.02831 | 0.04411 | 37 |
| Sum: | 742.79938 | 100% | 18014.64400 | 0.04210 | 581 |
Commulated Amount Of Sold $POB Per Person
This figure shows the top 10 $POB Sellers, how much they sold and how much $HIVE they got for this, sorted by $HIVE:
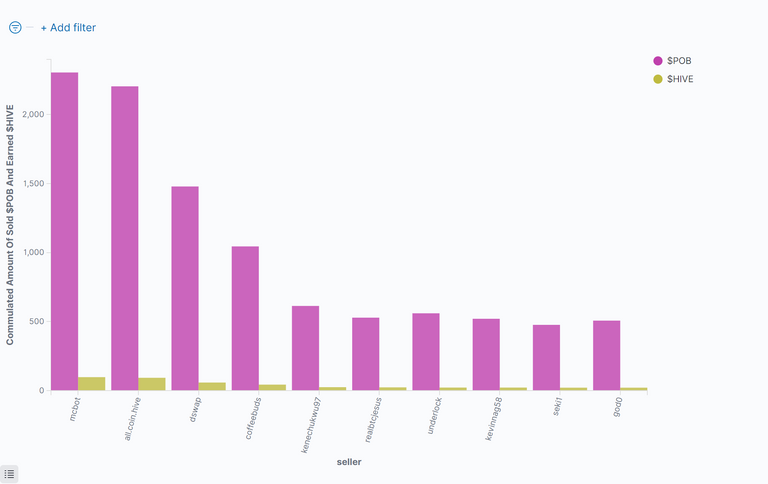
Table Of Top 20 $POB Sellers
This table shows the top ten sellers of $POB Sorted by the $HIVE, they have got:
| Seller(Descending) | Earned $HIVE | % Earned $HIVE | Sold $POB | Avg. Price | Number of Trades |
|---|---|---|---|---|---|
| @all.coin.hive | 109.49388 | 14.74 | 2595.81034 | 0.04287 | 7 |
| @mcbot | 97.31429 | 13.10 | 2305.04623 | 0.04223 | 48 |
| @dswap | 58.60597 | 7.89 | 1486.83547 | 0.03964 | 21 |
| @coffeebuds | 43.09475 | 5.80 | 1044.68210 | 0.04144 | 9 |
| @kenechukwu97 | 24.67281 | 3.32 | 613.27212 | 0.03967 | 6 |
| @realbtcjesus | 23.30041 | 3.14 | 528.35400 | 0.04410 | 1 |
| @underlock | 21.84006 | 2.94 | 560.00000 | 0.03900 | 9 |
| @kevinnag58 | 21.77338 | 2.93 | 520.27185 | 0.04185 | 1 |
| @seki1 | 21.00000 | 2.83 | 476.19040 | 0.04410 | 1 |
| @god0 | 20.97140 | 2.82 | 506.94059 | 0.04143 | 6 |
| @michupa | 20.89900 | 2.81 | 509.73178 | 0.04100 | 1 |
| @rob23 | 20.06929 | 2.70 | 486.81688 | 0.04153 | 4 |
| @friendlymoose | 16.50194 | 2.22 | 400.45449 | 0.04125 | 2 |
| @beemd | 13.10592 | 1.76 | 310.22561 | 0.04151 | 10 |
| @shanhenry | 12.22250 | 1.65 | 296.35194 | 0.04147 | 3 |
| @onlydoge | 10.33217 | 1.39 | 243.83103 | 0.04284 | 12 |
| @snook | 10.20527 | 1.37 | 245.88602 | 0.04156 | 4 |
| @loveah | 10.10971 | 1.36 | 239.00000 | 0.04230 | 8 |
| @bitcoinflood | 9.42451 | 1.27 | 240.77036 | 0.03985 | 10 |
| @luizeba | 7.95138 | 1.07 | 198.78438 | 0.04000 | 1 |
| others | 169.91070 | 22.87 | 4205.38839 | 0.04070 | 417 |
| Sum: | 742.79934 | 100% | 18014.64398 | 0.04078 | 581 |
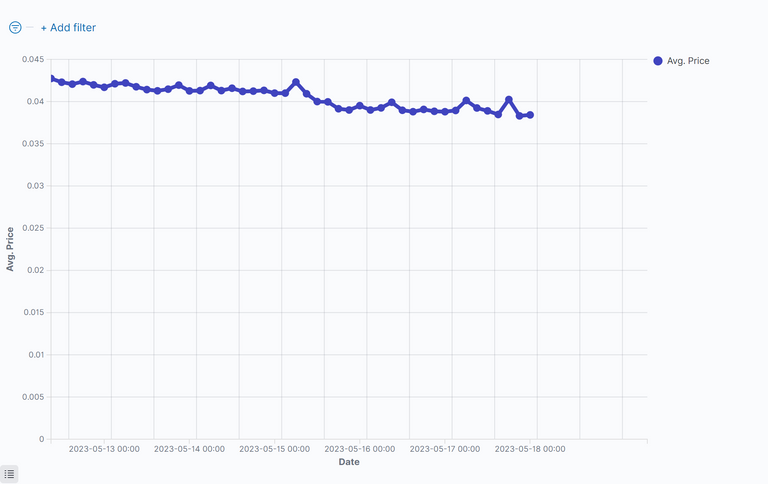
Price of the $POB
This figure shows the price of $POB for the last period:
$POB Summarize Metrics
This table shows how much $HIVE was given by buy-requests, that where equal or higher than the sell order vs. sell-requests, that were equal or lower than the buy order.
If the buy-requests where higher than the sell-requests, then money comes into the system and the value of the token increases.
Under the total line one can see the sum of $HIVE and sum of $POB that changed the ownership and the average price of $POB for the last period.
| Request | Received Hive | Received HIVE % | Sold $POB | Avg. Price |
|---|---|---|---|---|
| sell | 462.10202 | 62.21% | 11348.19627 | 0.04055 |
| buy | 280.69732 | 37.79% | 6666.44769 | 0.04155 |
| sum: | 742.79934 | 100% | 18014.64396 | 0.04105 |
Comparison With Other Tokens
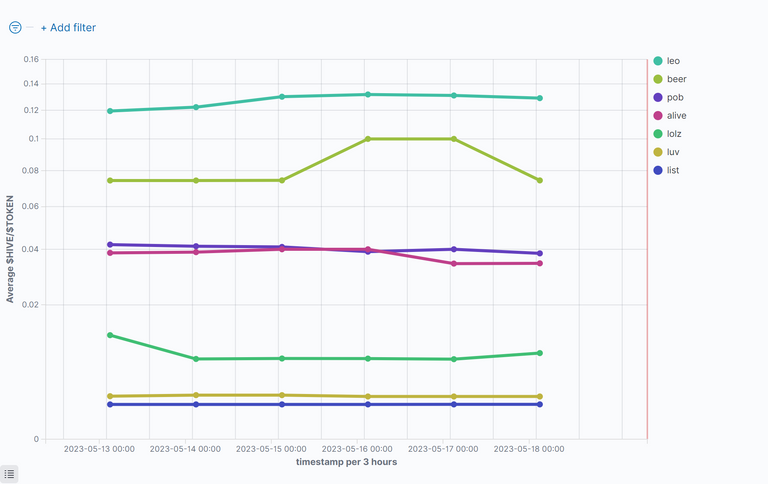
$HIVE/Token
This figure shows the value of $HIVE compared to some token for the last period. Be aware of the nonlinear (root square) y-axes.
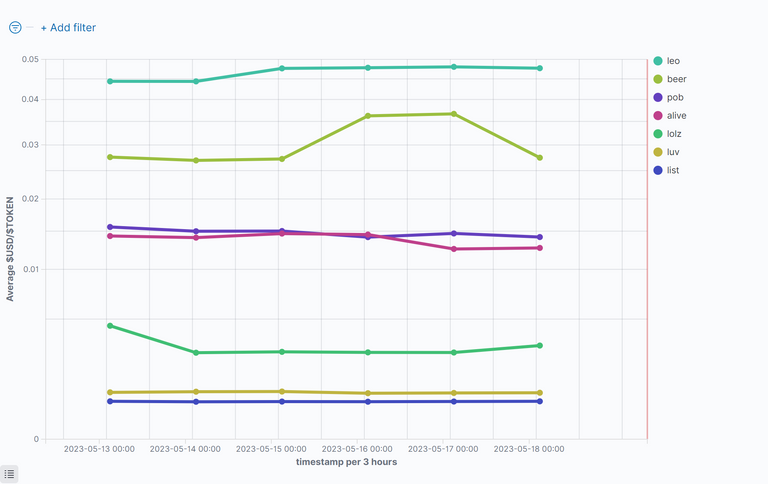
US-Dollar/Token
This figure shows the value of $USD compared to some token for the last period. Be aware of the nonlinear (root square) y-axes.
The HIVE rank in Coinmarktecap is: 156
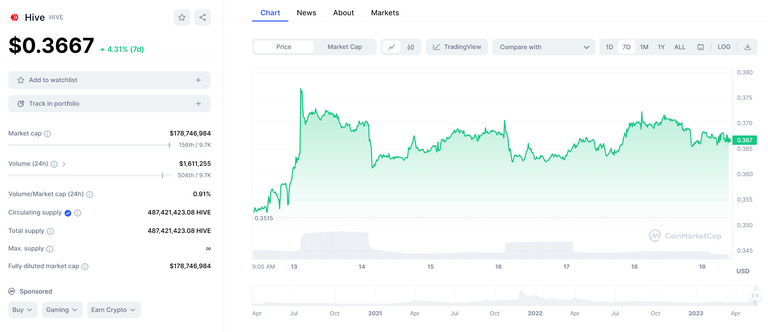
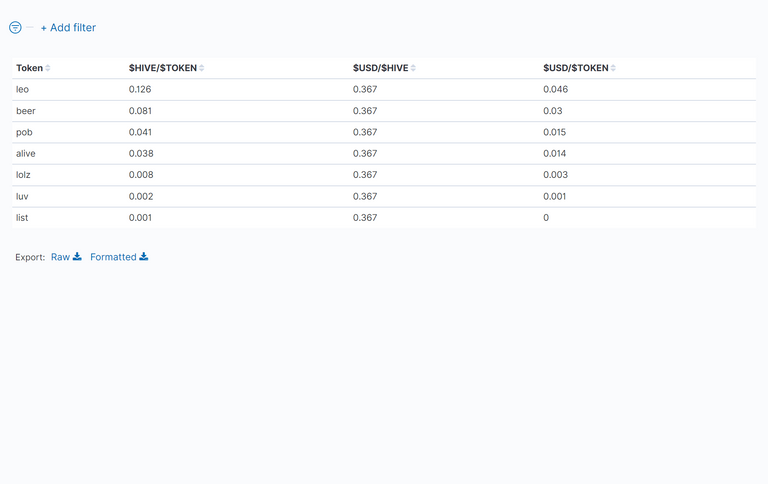
Table Of Token Prices in $HIVE and $USD
This table shows the average value of the prices of the token for the last period. One can see Hive and the US-Dollar compared to the token.
Disclaimer
All stats are without warranty.
They are taken from:
curl -XPOST -H "Content-type: application/json" -d '{ "jsonrpc": "2.0", "method": "find", "params": { "contract": "market", "table": "tradesHistory", "query": { "symbol": "TOKEN"}, "limit":1000, "offset": 0 }, "id": 1 }' 'https://api.hive-engine.com/rpc/contracts'
I have put them into logfiles and uploaded them to Kibana, from which I took the screenshots.
If you find errors, please tell me!
If you want me to continue the stats, give me some good upvotes ;-)
If you want to see other statistics (even from totaly other data), please contact me. I can create them weekly or monthly if I get some rewards for it.
For more details see here: How I Have Set Up Elasticsearch And Kibana On My Raspberry Pi To Monitor Token Activities and here: Do You Want To See Statistics Of Your Favorite HIVE Token? or on github.
Here are the stats from the other tokens I observe: https://peakd.com/@achimmertens/posts?filter=stats
Regards, Achim Mertens