Hello dear Hivers,
here are the:
$POB Statistics For The Last 7 Days, 2024-07-12 to 2024-07-19:
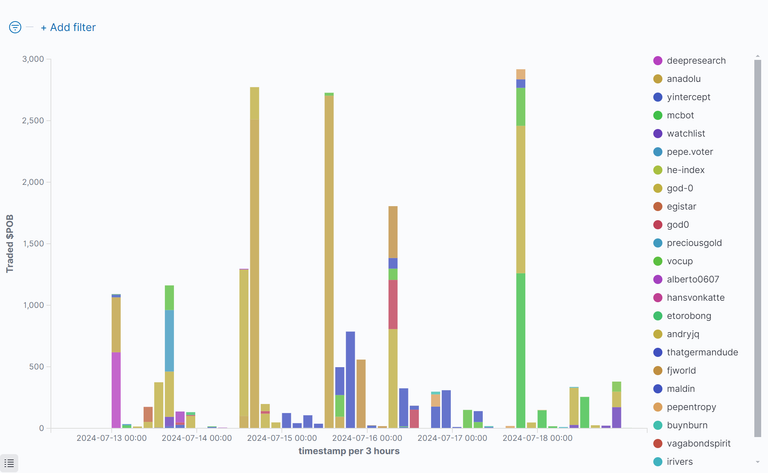
Who has bought how many $POB at which time:
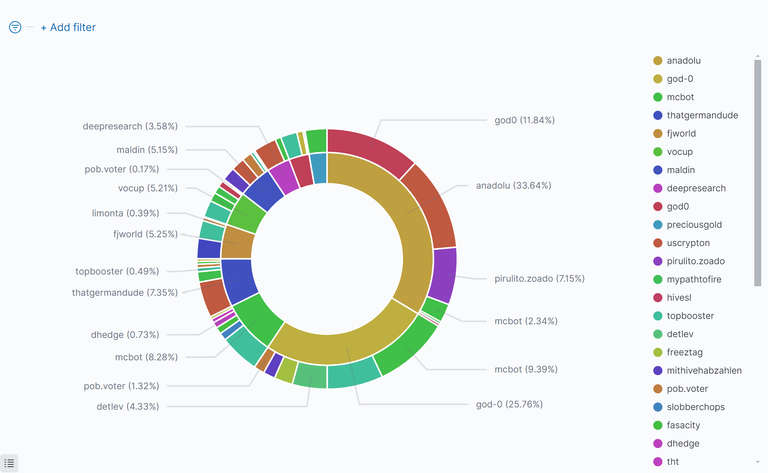
Top $POB Buyers And $HIVE Sellers
The inside of the circle shows the buyers of $POB, ordered by $HIVE they have spent. The outside shows the recipients of that $HIVE (sellers of $POB):
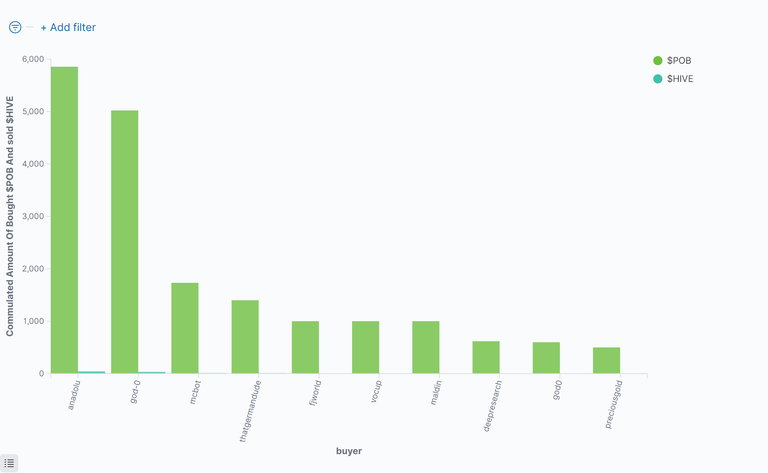
Comulated Amount Of Bought $POB Per Person
Top 10 $POB buyers, how much they got and how much $HIVE they spend for this. Sorted by $HIVE, that was spent:
Top 20 $POB Buyers
Sorted by the $HIVE, they have spent:
| Buyer(Descending) | Sold $HIVE | % Sold $HIVE | Bought $POB | Avg. Price | Number of Trades |
|---|---|---|---|---|---|
| @anadolu | 42.72720 | 31.71 % | 5855.01993 | 0.00701 | 24 |
| @god-0 | 32.72411 | 24.29 % | 5020.97127 | 0.00638 | 59 |
| @mcbot | 10.51235 | 7.80 % | 1732.60121 | 0.00639 | 39 |
| @thatgermandude | 9.33442 | 6.93 % | 1400.16417 | 0.00667 | 23 |
| @fjworld | 6.66667 | 4.95 % | 1000.00002 | 0.00667 | 18 |
| @vocup | 6.61939 | 4.91 % | 999.99998 | 0.00659 | 18 |
| @maldin | 6.54000 | 4.85 % | 1000.00002 | 0.00654 | 22 |
| @deepresearch | 4.55254 | 3.38 % | 617.71194 | 0.00737 | 3 |
| @god0 | 3.90307 | 2.90 % | 598.62703 | 0.00662 | 7 |
| @preciousgold | 3.44510 | 2.56 % | 500.00000 | 0.00689 | 1 |
| @watchlist | 1.95541 | 1.45 % | 300.96905 | 0.00650 | 20 |
| @pepentropy | 1.30851 | 0.97 % | 200.00000 | 0.00654 | 4 |
| @egistar | 1.00000 | 0.74 % | 121.86595 | 0.00813 | 14 |
| @yintercept | 0.90108 | 0.67 % | 132.54972 | 0.00672 | 14 |
| @alberto0607 | 0.67401 | 0.50 % | 100.57239 | 0.00673 | 9 |
| @fractoli | 0.60332 | 0.45 % | 81.86178 | 0.00737 | 10 |
| @andryjq | 0.45011 | 0.33 % | 57.96751 | 0.00714 | 2 |
| @irivers | 0.20635 | 0.15 % | 30.83876 | 0.00672 | 8 |
| @buynburn | 0.20088 | 0.15 % | 30.51000 | 0.00657 | 5 |
| @etorobong | 0.18402 | 0.14 % | 27.02248 | 0.00681 | 13 |
| others | 0.23590 | 0.18 % | 32.05942 | 0.00970 | 80 |
| Sum: | 134.74444 | 100 % | 19841.31263 | 0.00719 | 393 |
Comulated Amount Of Sold $POB Per Person
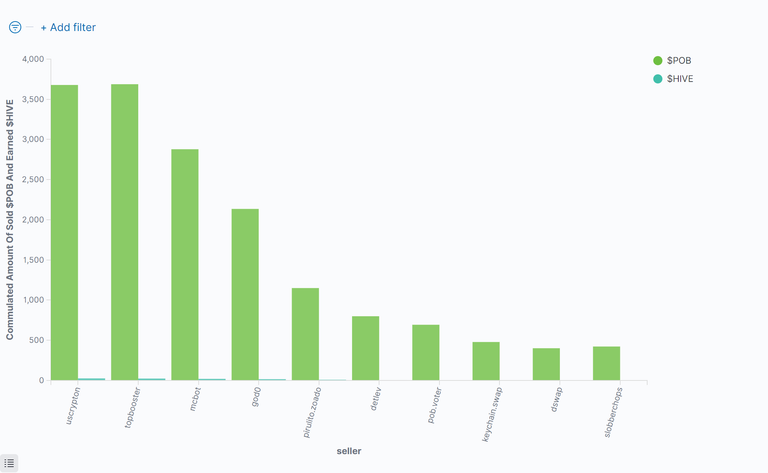
Top 10 $POB Sellers, how much they sold and how much $HIVE they got for this, sorted by $HIVE:
Top 20 $POB Sellers
Sorted by the $HIVE, they have got:
| Seller(Descending) | Earned $HIVE | % Earned $HIVE | Sold $POB | Avg. Price | Number of Trades |
|---|---|---|---|---|---|
| @uscrypton | 25.66013 | 19.04 % | 3678.15138 | 0.00713 | 11 |
| @topbooster | 23.50016 | 17.44 % | 3687.67912 | 0.00641 | 25 |
| @mcbot | 19.71253 | 14.63 % | 2878.18455 | 0.00678 | 17 |
| @god0 | 15.73852 | 11.68 % | 2135.34618 | 0.00715 | 4 |
| @pirulito.zoado | 8.91355 | 6.62 % | 1150.13488 | 0.00775 | 3 |
| @detlev | 4.84478 | 3.60 % | 799.42969 | 0.00606 | 4 |
| @pob.voter | 4.53214 | 3.36 % | 693.35872 | 0.00658 | 14 |
| @keychain.swap | 3.19022 | 2.37 % | 478.53207 | 0.00667 | 1 |
| @dswap | 2.67333 | 1.98 % | 401.00000 | 0.00667 | 3 |
| @slobberchops | 2.61712 | 1.94 % | 422.41788 | 0.00632 | 8 |
| @freeztag | 2.57146 | 1.91 % | 369.98804 | 0.00695 | 2 |
| @kenechukwu97 | 2.08740 | 1.55 % | 319.17432 | 0.00654 | 2 |
| @mithivehabzahlen | 1.65164 | 1.23 % | 254.09395 | 0.00650 | 2 |
| @josediccus | 1.20741 | 0.90 % | 192.56435 | 0.00627 | 5 |
| @watchlist | 1.12737 | 0.84 % | 150.25974 | 0.00749 | 38 |
| @fasacity | 1.02499 | 0.76 % | 162.69643 | 0.00630 | 1 |
| @zallin | 0.98259 | 0.73 % | 150.24113 | 0.00654 | 1 |
| @dhedge | 0.88777 | 0.66 % | 146.48479 | 0.00606 | 1 |
| @evernoticethat | 0.87511 | 0.65 % | 133.68263 | 0.00656 | 4 |
| @bitcoinflood | 0.75935 | 0.56 % | 115.84754 | 0.00655 | 8 |
| others | 10.18681 | 7.56 % | 1522.04524 | 0.00688 | 239 |
| Sum: | 134.74438 | 100 % | 19841.31263 | 0.00684 | 393 |
Price Of The $POB
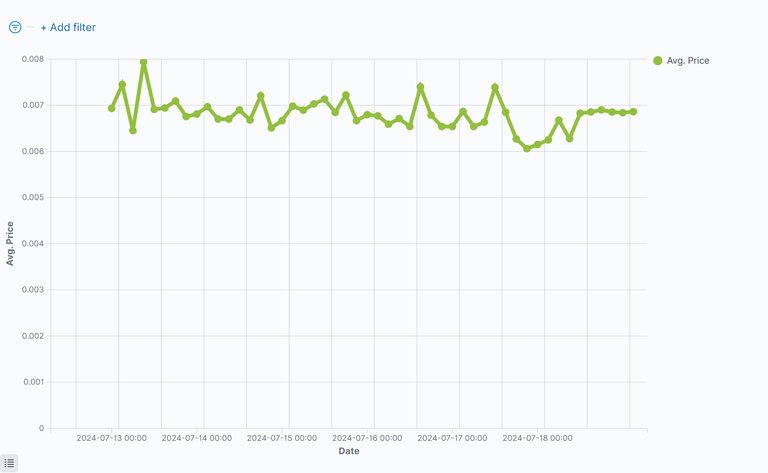
$POB Summarize Metrics

| Request | Received Hive | Received HIVE % | Sold $POB | Avg. Price |
|---|---|---|---|---|
| sell | 113.73352 | 84.41% | 17110.07599 | 0.00657 |
| buy | 21.01091 | 15.59% | 2731.23663 | 0.00742 |
| sum: | 134.74443 | 100% | 19841.31262 | 0.00700 |
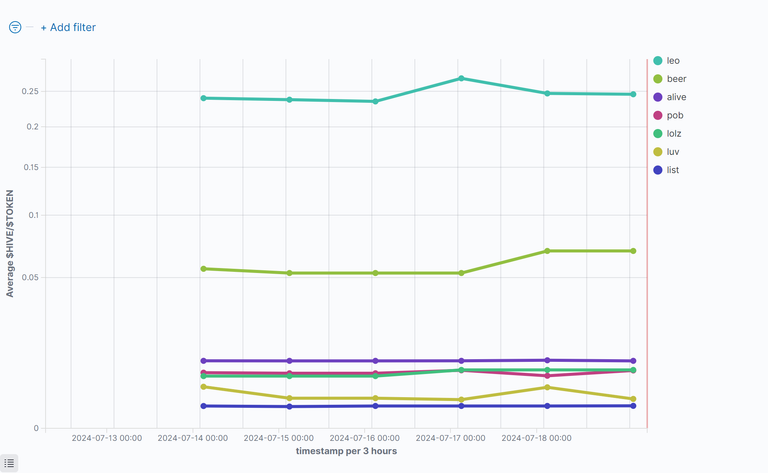
Comparison With Other Tokens
$HIVE/Token
This figure shows the value of $HIVE compared to some tokens. Be aware of the nonlinear (root square) y-axes.
US-Dollar/Token
Value of $USD compared to some token. Be aware of the nonlinear (root square) y-axes.
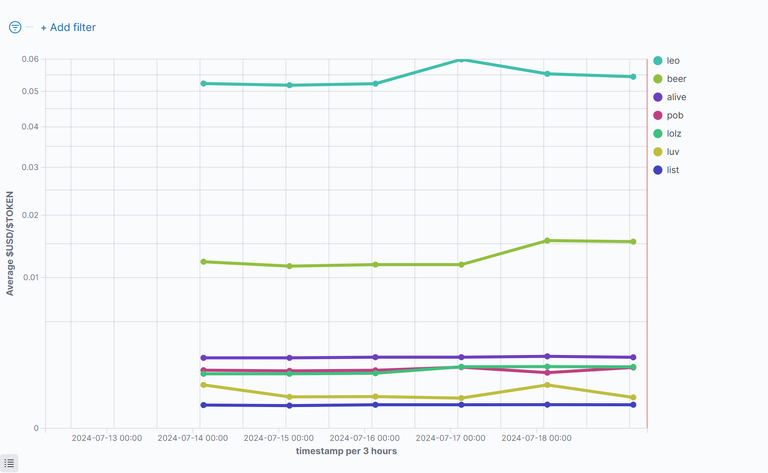
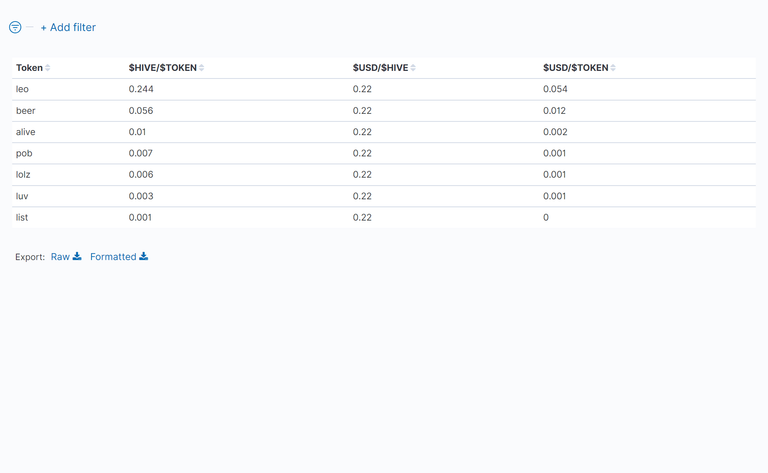
Table Of Token Prices in $HIVE and $USD
Average value of the prices of the token. Hive and US-Dollar compared to the token:
Links:
How I Have Set Up Elasticsearch And Kibana On My Raspberry Pi To Monitor Token Activities and here: Do You Want To See Statistics Of Your Favorite HIVE Token? or on github.
https://peakd.com/@advertisingbot2/posts?filter=stats
https://peakd.com/@achimmertens
https://github.com/achimmertens
My last Week
I am back home again. The two weeks before have been very special. We wanted to go on holliday, but my wife got corona and so we started a few days later. And then we had some adventures, which you can find here and here.

Now we are back and the normal work has already started.
The code to run my reporting scripts usually cannot work without me - that is what I thought. But it did on friday two weeks ago. So you got presented the three weeks old statistics, for which I want to apologize.
I have fixed the bug and hope it doesn't happen again.
Regards,
Achim Mertens
