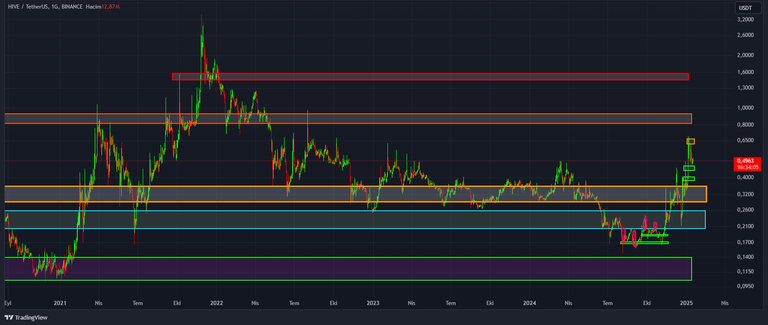
Hello everyone. I wanted to share with you the current version of the Hive/USDT chart that I follow. The last time I shared was in November. When I made the post in question, the Hive price was at $0.24. I took the screenshot below from the Binance Exchange data on the Tradingview site.

The chart above is on the daily time frame. The supply-demand zone below is between the price range of 0.35-0.29. The supply-demand zone above is between the price range of 0.81-0.92.

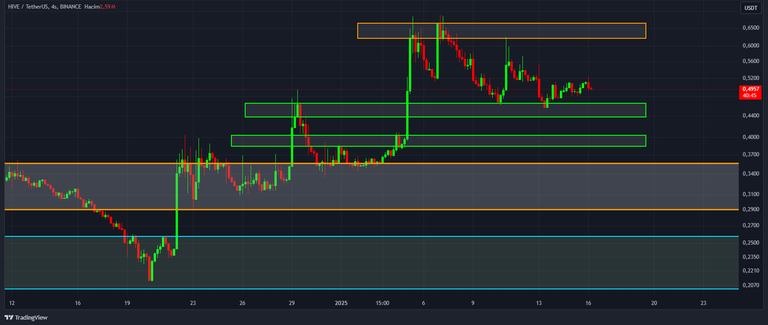
The green supply-demand zones I have drawn below are between the price levels of 0.46-0.43 and 0.40-0.38. The supply-demand zone above is between the price range of 0.62-0.66. I will be monitoring whether the price will remain above the level of 0.4-0.43 for a possible uptrend.
I am not an investment consultant. You should make investment and trading decisions according to your own financial and psychological state. It would be more useful to see such analysis sharing as an educational study. See you again. Stay tuned.
Posted Using INLEO