Hello everyone. I haven't shared a chart analysis since September. The last Hive chart share was in July. I link to the previous content in each Hive chart share. You can access the previous Hive analysis here. When I made the previous share, Hive was at $0.21.
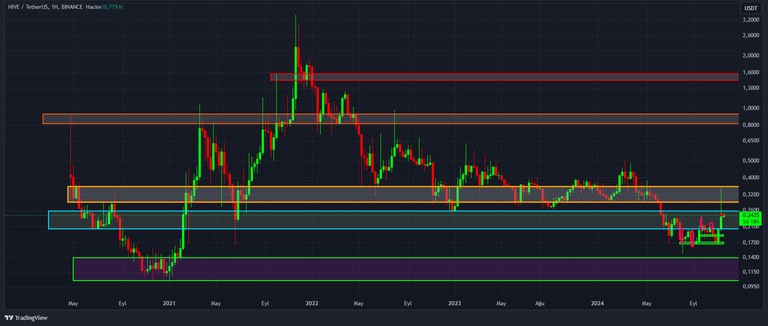
In this share, I will add charts on longer time frames for medium and long-term investors. Chart shares for trading users will come in later shares. I follow the data from the Hive/USDT parity on the Binance exchange. I took the screenshot from the Tredingview site. Previous price movements in the weekly time frame are as follows;

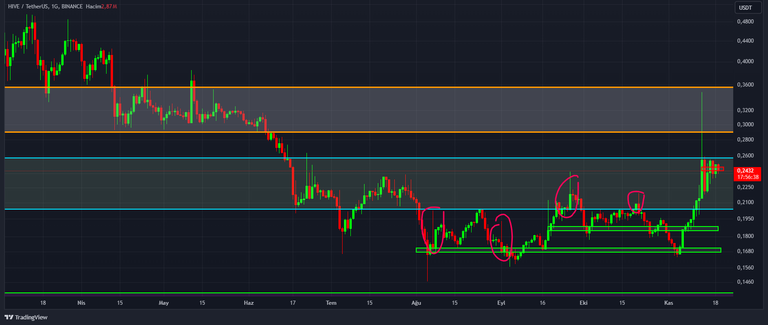
The chart below is from the daily time frame. We need to wait for a permanent move above the 0.35-0.45 price level for the start of an uptrend.

The supply-demand zone where the price is located is passing through the price range of 0.203-0.257. The supply-demand zone above is passing through the price range of 0.29-0.35.
A short-term price movement to $0.34 occurred recently. Hive makes such short-term price movements regularly. However, our expectation is for it to enter a trend with regular price movements. I will continue to enter buy/sell orders gradually until I see a regular price movement.
I am not an investment consultant. You should make investment and trading decisions according to your own financial and psychological state. It would be more useful to see such analysis sharing as an educational study. See you again. Stay tuned.
Posted Using InLeo Alpha
