Splinterlands is an awesome game on the Hive blockchain and it brings an abundance of fun, but also tokenomics. And with that, a player needs to make use of the management skills either within his own collection or when trading on the market. The in-game market is good enough for individual trading, but in case you are doing bulk actions you have a complete solution embedded within Peakmonsters. But in both cases when you try to figure out the market and the value of the NFT card you want to buy or sell, there isn't any aggregated information that would give you a historical image.

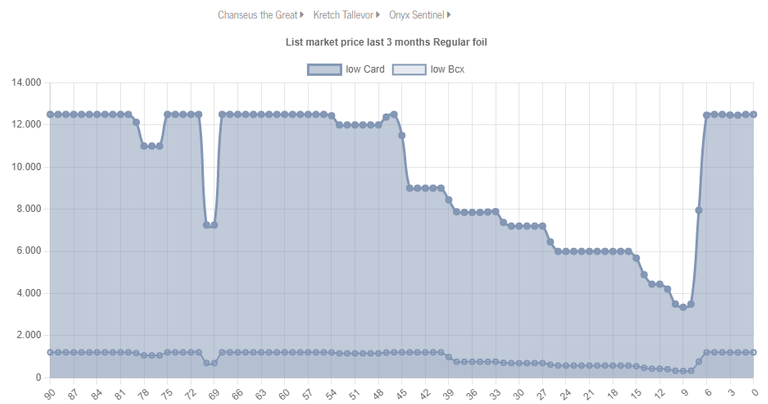
You might ask why such a historical price graph is needed? Because it can show the trend of the NFT card, you can see the evolution in different periods and even try to predict in which direction it will go. All these are precious pieces of information for traders or any user that wants to make the most of his assets or the ones from the market.

Let's break down a little bit how I think this Card Price Evolution Graph should look like and what elements it should have. This would be a minimum and it could be enhanced later on with other elements or in-depth view or additional information, but the price image resulted should be clear enough for anyone to understand through a simple look at it.
- Price Symbol ($ or Hive) should allow users to see the price evolution graph either using fiat (USD) or a specific crypto (HIVE). Having these views could result in different trends so I think both are important. The referred cryptocurrency can be HIVE or other - DEC, SPS, or something like that.
- Price Period (1M...ALL) should provide depth to the analyzed historical price graph and allow the users to focus on a smaller period or on the overall market.
- Price Graph should contain the representation of the NFT price evolution using the price/time axis. This will show how the NFT card trended until now and we can spot in which direction it tends to go.
I think that the above elements are good enough starting points to offer more information to traders and users that would help them make a better decision either to BUY or SELL one asset or the other. And if such graph will be implemented the next move would be to extend it also for the Rental market as it will fit like a glove.

When proposing this improvement I must say that I got inspired from Atomic Hub on WAX blockchain, so the concept is already confirmed to be useful by millions of users. Hopefully, the Hive blockchain and/or Hive-Engine hold the data to be able to translate it into NFT Card Price Graphs to assist the users in their decisions. What do you think about this, do you miss such a functionality and consider it useful?
Posted Using LeoFinance Beta

