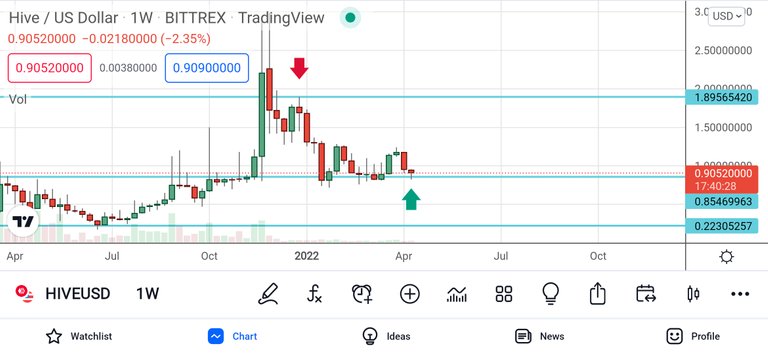
Hive/USD chart

My comments :-
If you close look at the Hive/USD chart above then you'll realize that Hive is moving just like every other cryptocurrency in existence which is Breakout-->Downtrend --> Accumulation--> Breakout above previous highs and repeat.
The above phenomenon has previously happened with Hive too.
Phase 1
Breakout :- Price of Hive broke out above 22 Cents with a high of 90 cents.
Downtrend :- Price declined to 22 cents from 90 cents.
Accumulation :- Look at the chart from left to right from Apr-21 to Nov-21 which Hive was in accumulation zone with an extended range of 22-90 cents a piece.
Phase 2
Breakout :- The price of Hive broke 90 cents barrier with an high of $2.98 and an low of 90 cents
Downtrend :- Price declined to 90 cents from $2.98.
Accumulation :- Currently we are here .
We are 100% in a range of price action between $2.98 and $0.90. Breaking of any of these barrier will define a longer term trend for hive.
In my personal opinion, I think Hive will maintain the 90 cents price and even be pressurized due to geopolitics creating that pressure on crypto as a whole.
For short term, I expect it to decline till 80 cents or stay currently at 90 cents
Longer term :- For a longer term perspective we have established that it needs to break that $2.98 barrier to make new high else it'll be in a range bound circle forever. I think for that to happen it should take a year or two which I am fine by.
Risks :- My only concern is strong selling pressure short term could drive prices to new lows but it shouldn't break that 80-90 cents marks because if it does then the next significant demand zone it at 50 cents/Hive mark and could trigger a longer term suppression of prices.
Let's see how everything will pan out. It'll be interesting to see that.
What are your thoughts on it ?
Upvote and comment on this post to support my blog. It means a lot. Any suggestions or tips are welcomed as well.
Take care. Peace out.
Posted Using LeoFinance Beta
