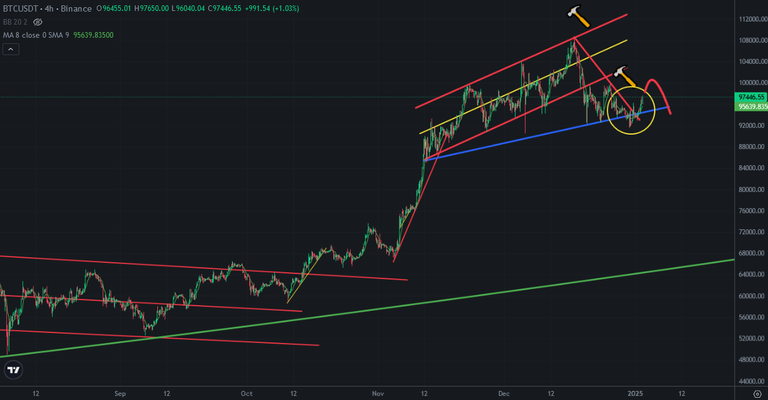
Bitcoin made another bullish trap at the end of 2024 while touching 92K. Even Bitcoin price broke down support level, It was close to downtrend line and It broke up this downtrend line. After retesting downtrend and support lines, Bitcoin price started to go up..
Here you can see 4-hour chart of Bitcoin. I shared a few analysis about this possible breaking up. Downtrend and support lines would be crossed until 1st January. It happened. Bitcoin price chosed the direction and It started to go uo. 99K is major resistance that is last high. Bitcoin price should break up this resistance to go up more. If not, we will see another top and another downtrend line on Bitcoin price chart. I drew possbile scenario on Bitcoin price chart.
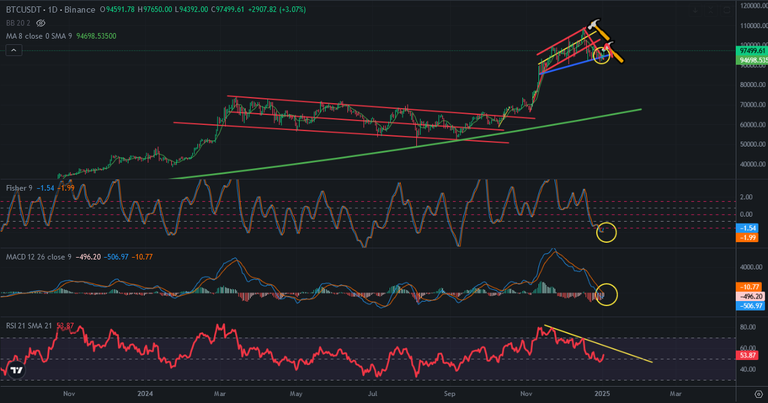
Even most of indicators started to seem as bullish, There is big downtrend line on RSI Indcitor. Bitcoin price may go up until touching this resistance and we may see again downtrend on Bitcoin price chart resisting by this downtrend line..
MACD and Fisher Indicators are at good level for bullish. MACD Indicator may reverse in this try.
There is no hype after most of altcoins are down 50% from the top. So, Bitcoin price may not break up 100K in this time. We may see wavy price action on Bitcoin price chart until end of January.
We will see..
Posted Using InLeo Alpha

