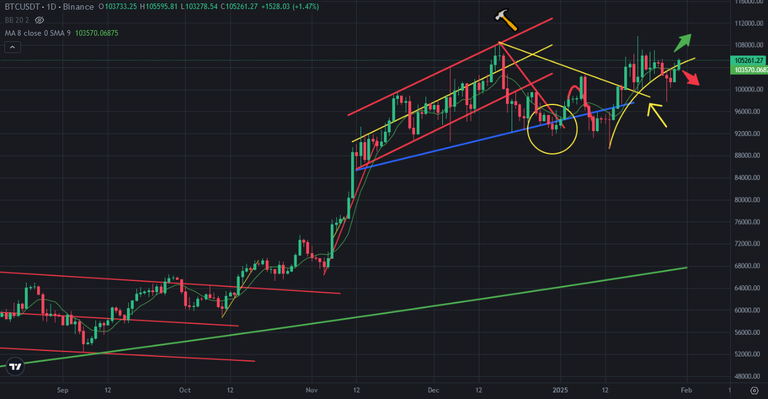
Volatility is on Bitcoin price chart. Bitcoin price is moving in 10% range in a day. It is hard to predcit the direction of the move of Bitcoin price chart. There was a curve resistance on Bitcoin price chart. After getting huge daily candles, Bitcoin price broke up this resistance today. Bitcoin is at green side. Bullrun may continue.
Here you can see daily chart of Bitcoin. After tocuhing 97K, Bitcoin price got 2 green candles. It may hard to predict the recovery of loses on Bitcoin price chart.
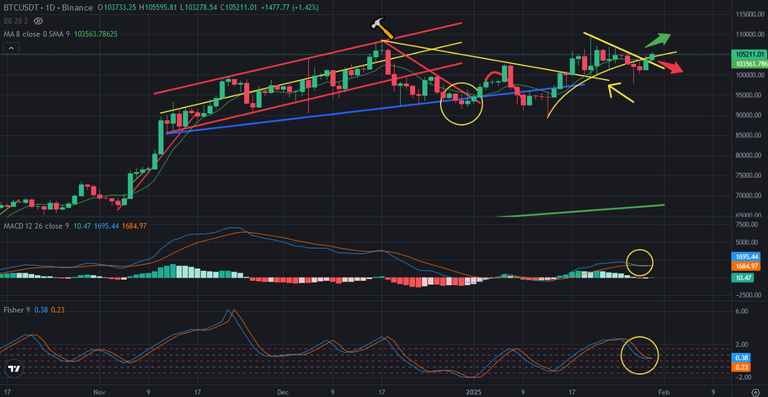
Here you can see the indicators on daily chart of Bitcoin. Fisher Indicator is trying to reverse up. MACD Indicators is also trying to reverse up and It is done. So, we need only a few green candles on daily chart of Bitcoin. After these green candles, we may see huge bullish price moves on Bitcoin price chart.
There was also a downtrend line coming from all time high. Bitcoin price also broke up this downtrend line.
As I said, it is hard to predict Bitcpin chart. Market maker always tries to make fake moves. Bitcoin price broke up the resistances. We may see all time high again.
We will see..
Posted Using INLEO