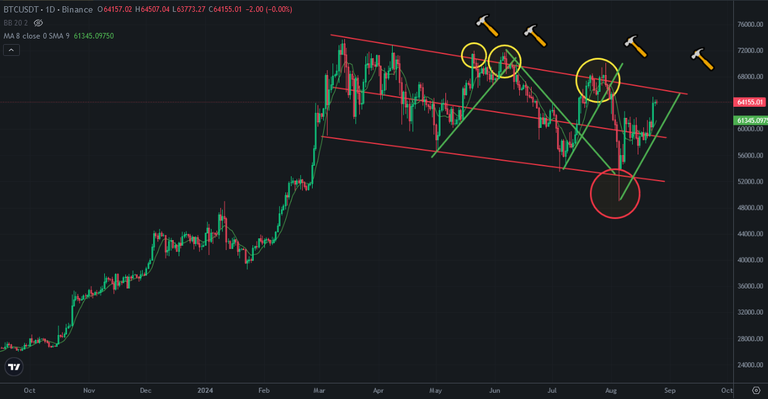
Bitcoin price is at 64K after good news on last week. Lots of investors started to dream for new all time high. I am getting ready to see 4th bullish trap on Bitcoin price chart. If It doesn't happen, we will see huge price pump on Bitcoin price chart.
Here you can see daily chart of Bitcoin. I shared this draft a few months ago. Bitcoin price stucked into this descending channel. After bearish trap on 47K USD, Bitcoin price went up fast and hit 64K today.
There is paralel uptrend line on Bitcoin price chart will be crossed be downtrend line that is top line of descending channel. We will see huge price moves after this crossing.
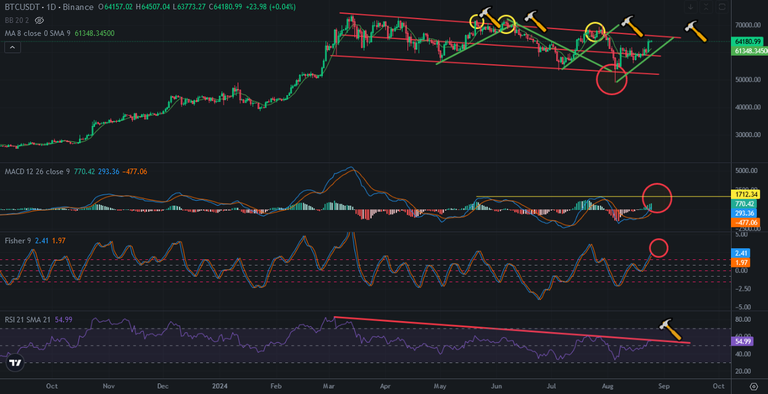
Here you can see the indicators on daily Bitcoin price chart. RSI Indicator will hit downtrend line. This is why I say that Bitcoin price is close to 4th Byllish trap. Bitcoin price may reverse from this level and go down in a few days.
There is also resistance on MACD Indicator. Fisher Indicator is on the top.
These indicator seems bearish in next week. So, It is possible to see red weekly candle in next week on Bitcoin price chart.
I am waiting with my cash to fill my bag with discounted cryptos.
We will see..
Posted Using InLeo Alpha


