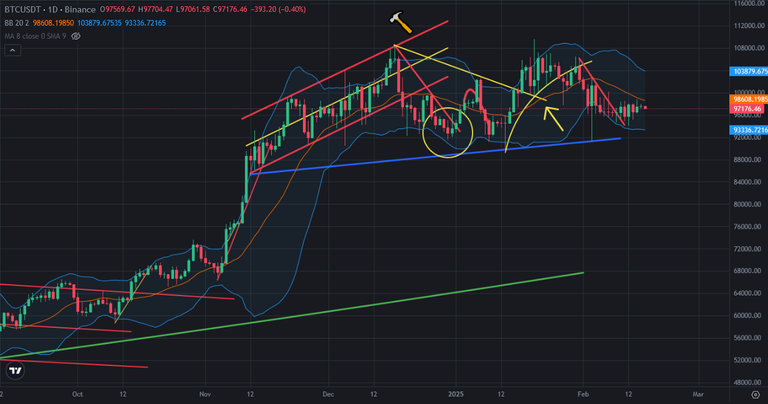
Bitcoin price touched one of resistance. The middle line of Bollinger Bands on daily chart is one of the resistance for Bitcoin price. Here you can see daily char tof Bitcoin. You can see how it resisted Bitcoin price before and what happened after breaking up the middle line of Bollinger Bands. There is great support line on Bitcoin price chart. I drew it as blue line. Bitcoin price is close to this support line. It is hard to break down this support line. So, it is possible to see breaking up the middle line of Bollinger Bands in a few days.
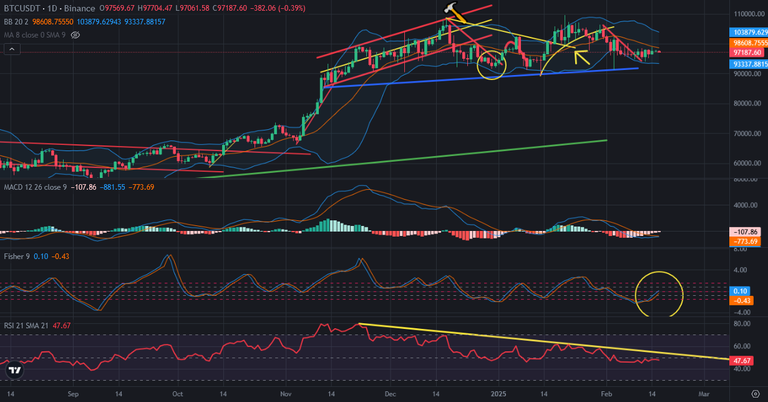
Here you can see the indicators on daily chart of Bitcoin. There is great resistance on RSI Indicator. MACD and Fisher Indicators are at good level for bullish. MACD Indicator is close to reverse up. You can see what happened after reverse up on daily chart of Bitcoin on MACD Indicator. So, we may see bullish move in a few days on Bitcoin price chart. I dont think that Bitcoin price can break up the resistance on RSI Indicator.
So it is possible to see bullish move on Bitcoin price chart until the resistance on RSI Indicator.
I don't think that we will see all time high in this month or March. Bitcoin price entered price correction. We may see price as stable in these levels.
We will see..
Posted Using INLEO