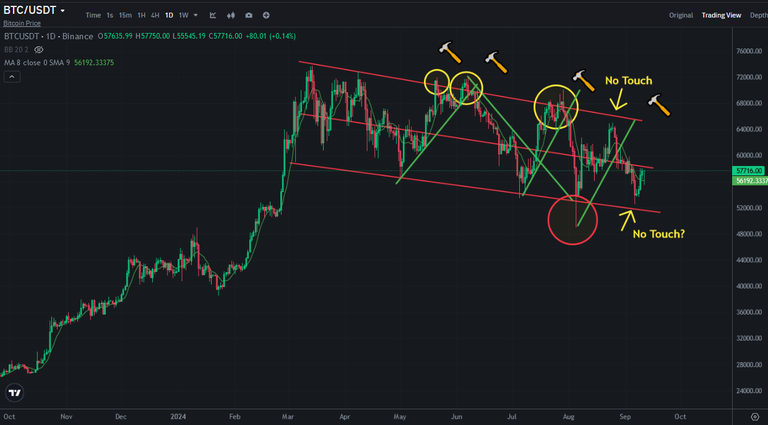
Bitcoin price reversed from the bottom with no touch the bottom line of descending channel. I shared an analysis about this and said It was so possible to see reversing without touch the bottom line of descending channel. Today Bitcoin price touched the middle line of descending channel. It may work as a resistance. Bitcoin should break up it very fast but we have seen 4 green candles in last 4 days. It is hard to see 5 green candles.
Here you can see daily chart of Bitcoin. We started to see reversings witouch touch resistance and support. It seems as bullish and bearish traps. We have seen lots of bullish and bearish traps in this year after breaking up and down. These are the very versions of market makers.
Here you can see the indicators on daily chart of Bitcoin. There is great resistance on RSI Indicator. It may take long time to see breaking up. Even Bitcoin price touch again 57K USD today, it is hard to see all time high. We will see after breaking of RSI Indicators downtrend line.
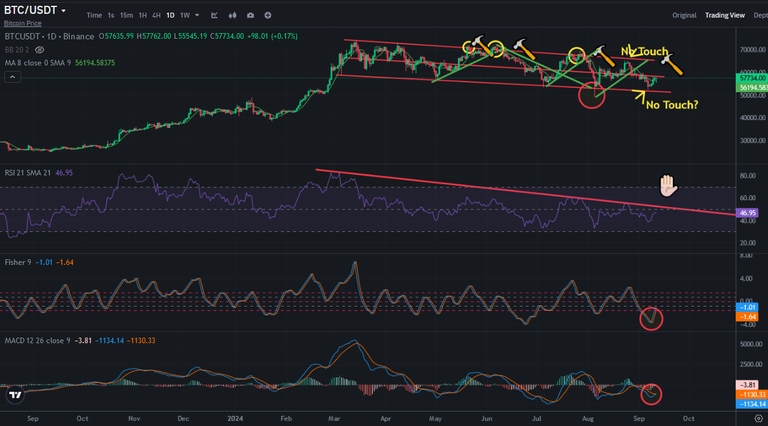
Even MACD and Fisher Indicators are on good level for bullish, it is hard to break up resistance in this market condition.
We need a story. FED may start the new story.
We will see..
Posted Using InLeo Alpha