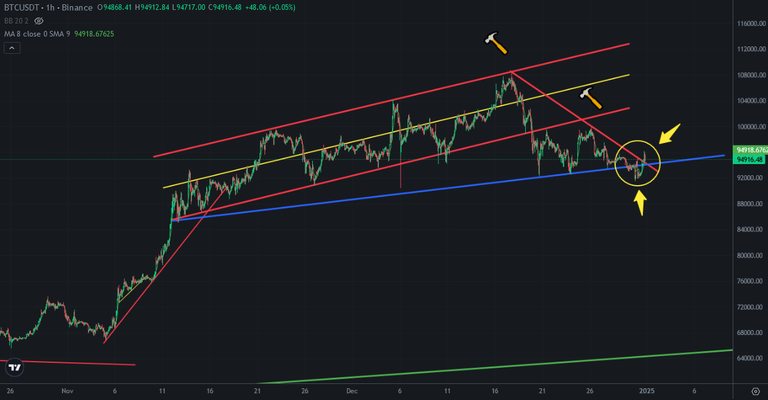
Bitcoin price broke down great support line yesterday. Even It broke down this support line, today it broke up downtrend line. One of them is a trap. We will see it is bearish or bullish trap.
Here you can see 1-hour chart of Bitcoin. I circled the traps. We will see if it is bullish or bearish.
We have seen lots of bullish and bearish traps on Bitcoin price chart in this year. Bitcoin broke down big ascending channel a few days ago. It may be early to reenter bullish trend.
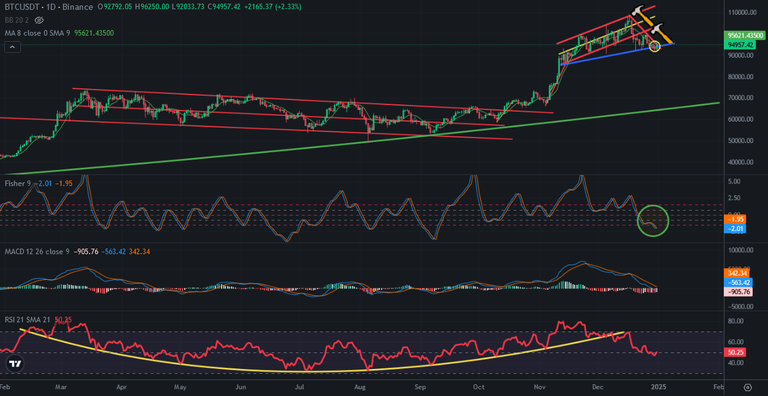
Here you can see daily chart of Bitcoin. Bitcoin broke down big bowl pattern on RSI Indicator. It may be early to reenter big bullish trend. 92K is important level for Bitcoin price. If it breaks down, Bitcoin price may go down fast to 75K.. There is mega bowl pattern on price chart. Its support line level is at 70K now. Bitcoin price and this support line may meet at 75K USD level..
So, Even we see bullish a few days on Bitcoin price chart, Bitcoin is still in price correction period. It may take long time. Because most of indicators are at high level. They need to enter correction..
We will see..
Posted Using InLeo Alpha


