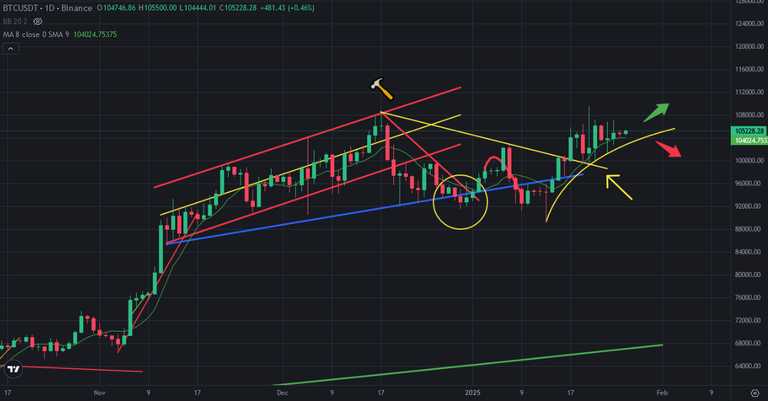
Bitcoin price is going up slowly. It is drawing a curve. The curve is getting as a horizontal line. It may be decision for Bitcoin price chart in next week. It will break down this curve or we will see price pump bitcoin price chart in next week.
Here you can see daily chart of Bitcoin. I drew a curve on Bitcoin price chart coming from 89K USD. The height of daily candles are decreasing.
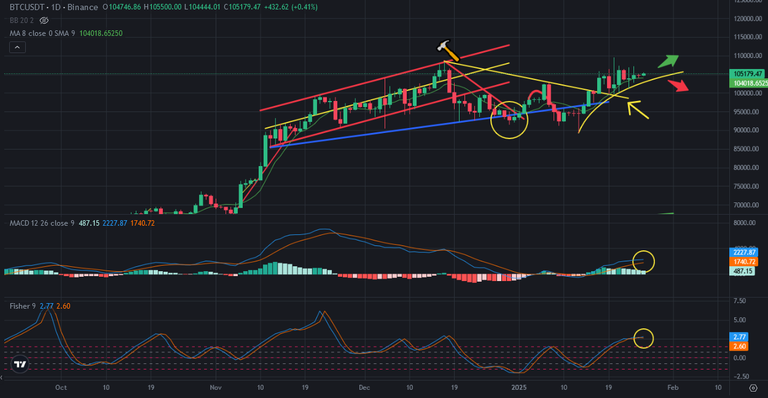
Here you can see the indicators on daily chart of Bitcoin. The height of daily candles is getting closer. MACD Indicator is on the top. It may reverse down if Bitcoin price gets read candle. Fisher Indicator is on the top and reverse down from this level or It may not. If Bitcoin price gets huge green candle, downtrend scenario will change with great bullish scenario.
This is why next week is so important. We should follow the trend in next week.
After Trump, news flow is getting harder. These news effect all crypto market. Even we look at the chart to analyze, we should predict what TRUMP will do.
We will see..
Posted Using INLEO


