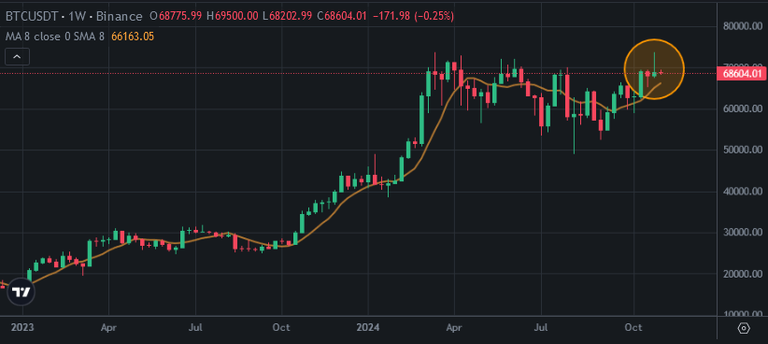
There seemed a doji candle on weekly chart of Bitcoin price. It may be the signal of reversing from the top. Even Bitcoin price got doji candle while trying to break up all time high, It is still above 8-week moving average which is midtrem trend signal. It is good to see weekly close above this average..
Here you can see weekly chart of Bitcoin. After touching all time high at 74K, Bitcoin got lots of weekly doji candles. This is the biggest one of the year. Even Bitcoin has doji candle, the colour of this candle is green.
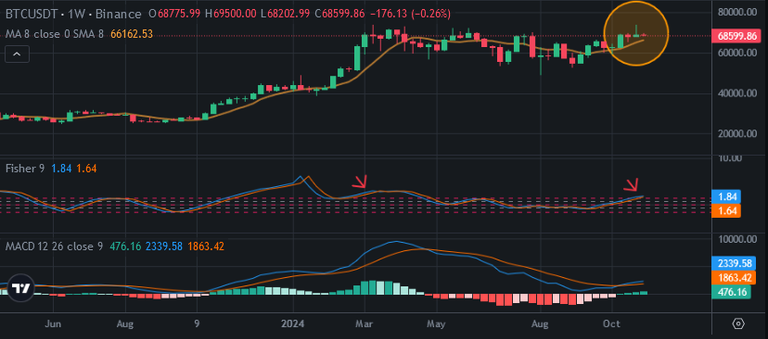
Here you can see the indicator on weekly chart of Bitcoin price. Fisher Indicator is at the same level as when Bitcoin touched 74K, It may reverse from this level. Even Fisher Indicator seems bad, MACD Indicator reversed from bottom. It is going up and It is great signal for bullrun.
Bitcoin may have price correction for Fisher Indicator with its doji candle, MACD Indicator also get more time for bull run.
If Bitcoin price enters bullrun, It may take a few weeks. We need bullrun taking lots of weeks..
2024 US Election is coming soon. Bitcoin will get decision to enter mega bullrun or not.
We will see the decision in this week.
Posted Using InLeo Alpha

