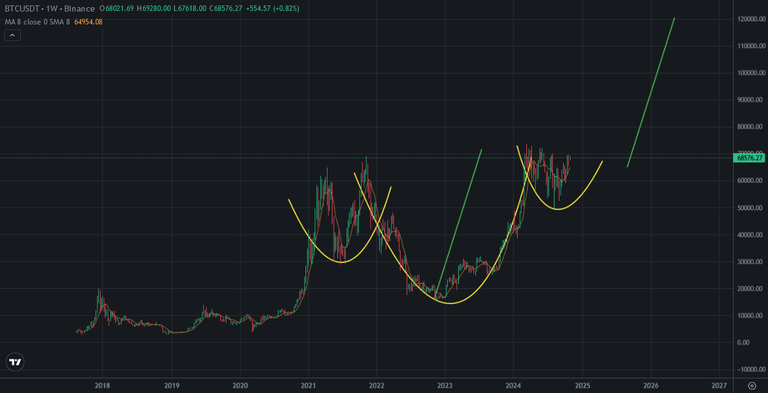
Bitcoin may be completing head and shoulders pattern. There are two shoulders and head on Bitcoin price chart when we look for long term. We are close to end of last shoulder. If this pattern happens, price target of Bitcoin price chart is 120K USD..
Will it happen?
Here you can see weekly chart of Bitcoin. It is under construction for 4 years. After 4 years, 120K is less target for me. It is only 2x profit on Bitcoin price chart. It should be more!
Price target should be more. Because all of market waited for 4 years! When we calculate the inflation of market, it is less than %50..
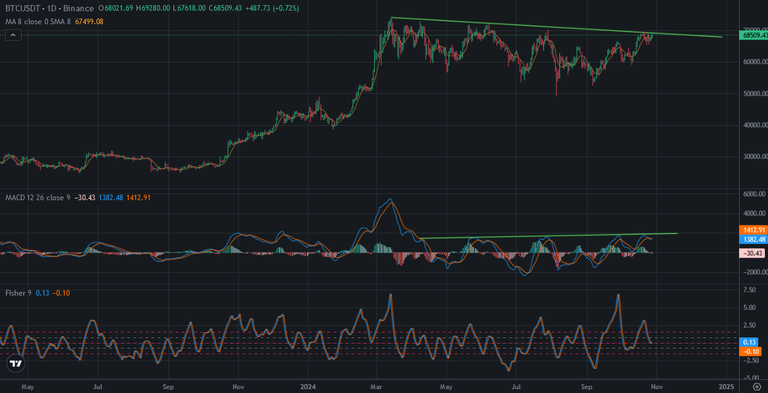
Bitcoin price is still under the resistance on both price and MACD Indicator. Here you can see daily chart of Bitcoin. Today Bitcoin touched again downtrend line on price chart. MACD Indicator is trying to reverse up.
If MACD Indicator breaks up great resistance, Bitcoin price will break up price resistance and we will see all time high. 120K will be the next target of Bitcoin price if this scenario happens..
Fisher Indicator is also ready to reverse from the bottom. These are major reasons that we should see all time high in November!
2024 US election is coming soon. It is so possible to see all time high after the result of this election. It will see major trigger for Bitcoin price chart.
We will see...
Posted Using InLeo Alpha

