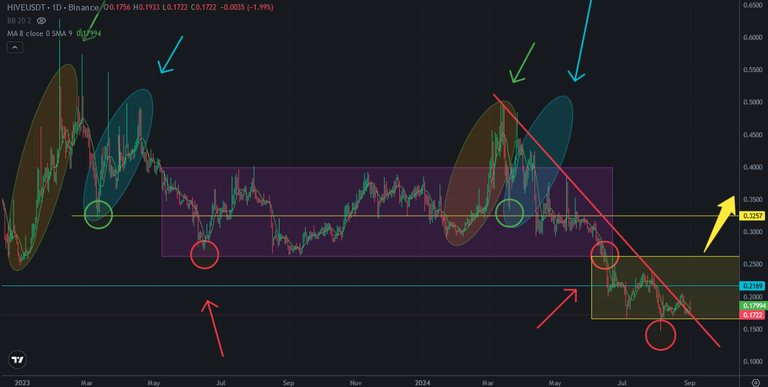
Today Hive price went up more than 10% from 0,175 to 0,195 in a few hours. It was a price pump test. Hive price is at the bottom in depression zone. Here you can see daily chart of Hive price. I drew this draft and shared a few months ago. Hive price is close to the bottom of depression zone..
While Hive price is close to the bottom of this zone, Hive price is trying to make a price pump. You can see what happaned after touching the bottom of this zone. 0,165 USD is the bottom level of this zone. Maybe Hive need to touch there to get more power to enter bullish trend.
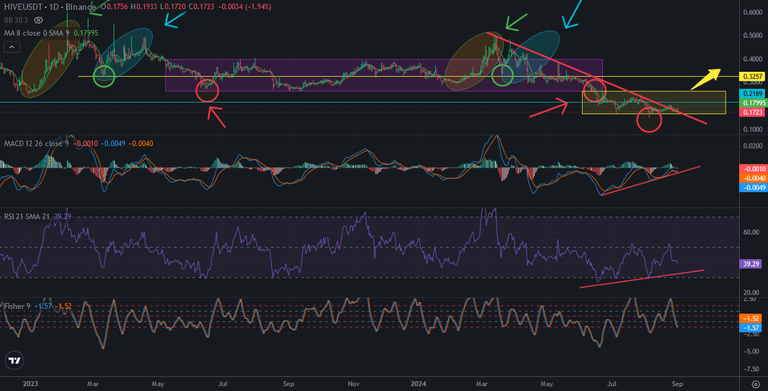
Here you can see the indicators of daily chart of Hive price. There is support line on MACD Indicator. Hive should not break down this support line. There is also possitive divergence on RSI Indicator. The bottoms of RSI Indicator is increasing but the bottoms of price chart is dexreasing. Price pump is close to Hive price chart.
Fisher Indicator is also at the bottom and ready to reverse. We may see price pump in next week.
I am waiting with my cash to buy more Hive. I will share my posts about buying Hive and powering up!
We will see..
Posted Using InLeo Alpha


