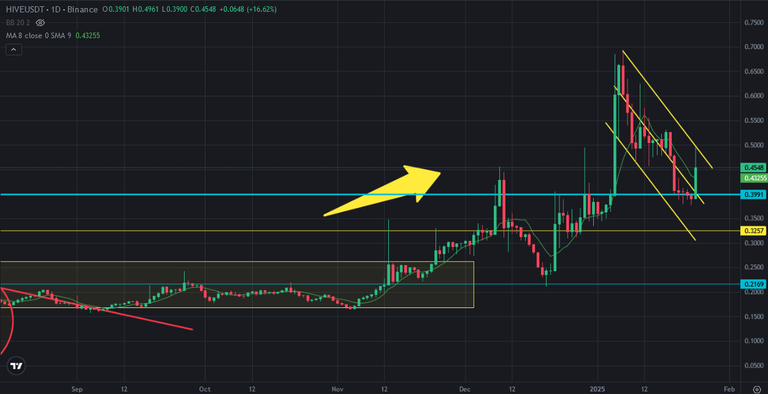
Hive price is under price correction after touching 0,70 USD. It was normal and healthy for Hive price chart. During this period, lots of altcoins are down more than 50%. Hive has still great performance..
Here you can see daily chart of Hive. Hive price is in descending channel. Today, It touched the top line of this descending channel and It can not break up. It is 2nd times that Hive price tested to break up.
0,40 USD was great support for Hive price chart. I shared a few analysis when Hive price is price correction after 0,70 USD. It supported Hive price as well..
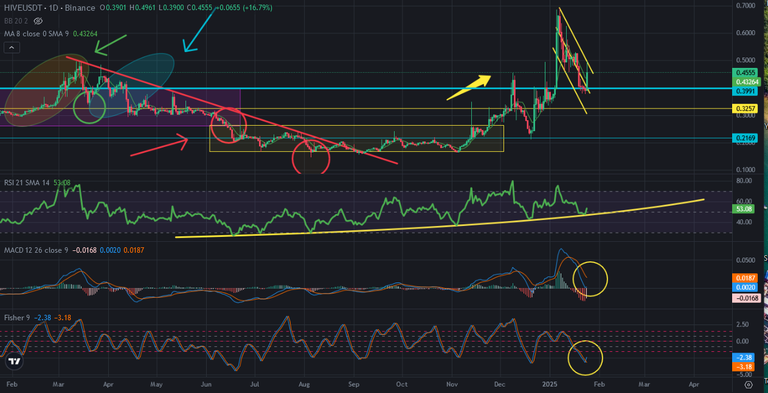
When we look at the indicators on daily chart of Hive price, we can see why Hive price went up. There was great uptrend line on RSI Indicator, Hive touched this support line. It supported Hive price as well and Hive is one of the best performer on crypto market today.
When we look at fisher and MACD Indicators, they seems as trying to reverse up from the bottom, They will complete their corrections and Hive price may break up descending channel in next try..
Hive will be the star of 2025 altcoin season. These are the voice of steps of Hive bull run.
We will see..
Posted Using INLEO

