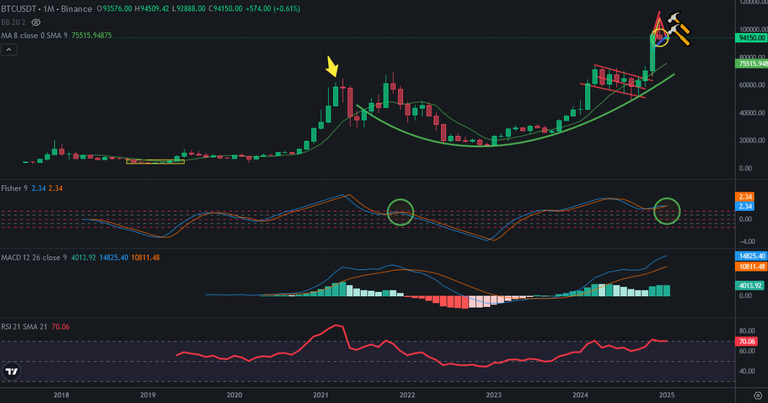
After getting red monthly candle, Bitcoin price chart started to seem as bearish. Here you can see monthy chart of Bitcoin. Bitcoin price may enter price correction on monthly chart. If it enters, it may take long time..
There is similarity between 2021 and now. Fisher Indicator moved as 2021. It is at same level as 2021 now. It is close to reverse down. If it reverses down in this month, it may take a few months to reverse up.
MACD Indicator is also at high level. If we see red monthly candle in January, it will start to go down. It is horrible to see MACD Indicator reversing down.
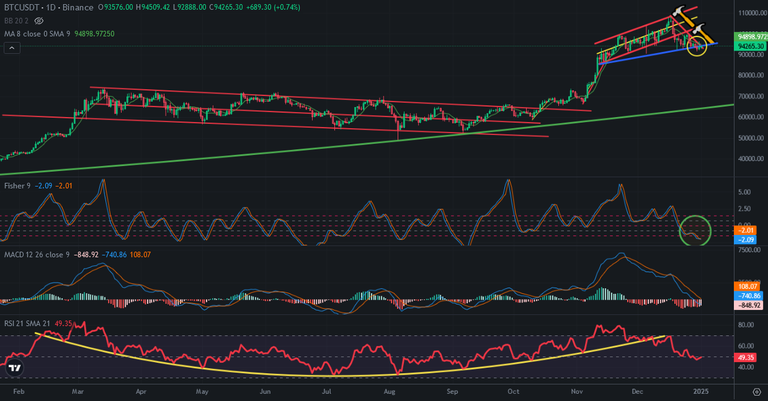
Here you can see daily chart of Bitcoin. Great bowl pattern on RSI Indicator is broken down. Even Fisher and MACD Indicators levels are at the bottom, Bitcoin may try to go down from this level. I shared a few posts about daily chart of Bitcoin. Bitcoin price was close to cliff. It may break down support line. If it breaks down, Bitcoin price may go down fast to 75K.. If this happens, Bitcoin price may enter bearish season at the beginning of 2025.
I shared lots of analysis and said, I would wait until end of January to make a decision about crypto market.
It will be important time for Bitcoin price for future..
We will see..
Posted Using InLeo Alpha


