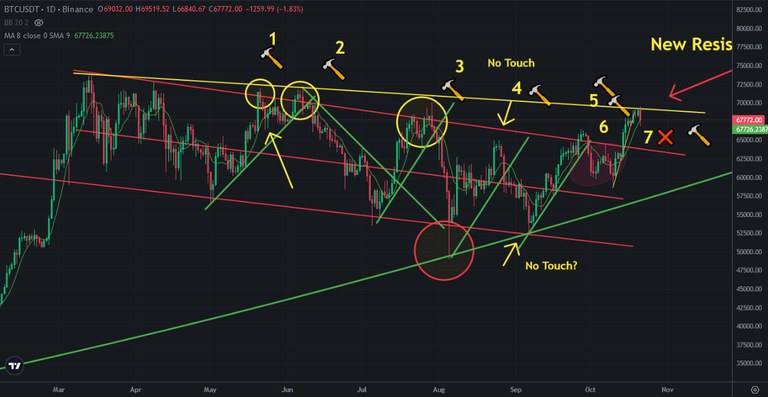
Bitcoin price seemed stable during above 67K in in last days, It is just started volatiliy days. I shared a post about possible price correction on Bitcoin price chart yesterday and It started.
Here you can see dailymchart of Bitcoin price. Even it seems as breaking up descending channel, Bitcoin price touched the resistance coming from all time high yesterday. Today Bitcoin price went down fast and It may be the beginning of price correction!
Bitcoin price is still above 8-day moving average, it is important for short-term trend.
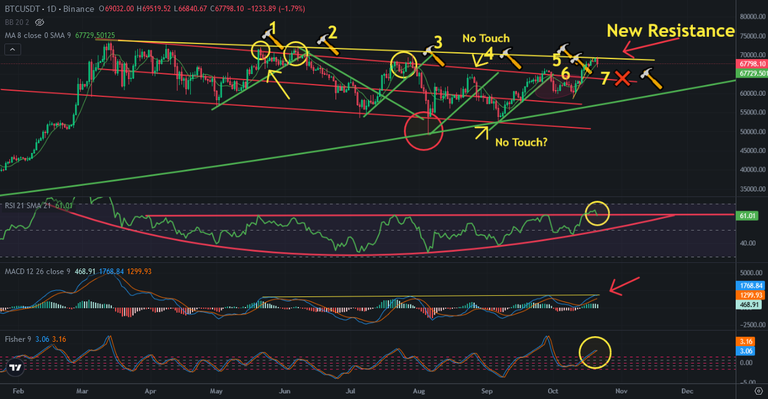
Here you can see the indicators on daily Bitcoin price chart. This is why I said you should be careful. MACD Indicator also touched great resistance! This is why Bitcoin price went down today. MACD Indicator can not break up this resistance Since April!
Fisher Indicator is also on the top and reversed. Even RSI Indicator broke up great resistance It should retest this resistance.
So, Bitcoin entered critical weeks. We may see huge volatility on Bitcoin price chart. Bitcoin should see the results of 2024 US election.
We will see..
Posted Using InLeo Alpha

