We now begin the usual review of Glassnode's charts, which once again attempt to answer the usual question: has the bear market come to an end, or is there still some descent to come?
This time Glassnode looks more closely at the behavior of long-term holders, who now remain the sole masters of the market ...

Before we look at this aspect, Glassnode presents us with yet another indicator that signals the truly extreme level to which the current descent has reached.
The current BTC quote, around $21,300, appears to be below the various oversold indicators we have seen in recent weeks, e.g., the Realized Price, the Meyer Multiple, and the 200-week moving average. In addition, the brief June 18 descent to $17,600 was below the Balanced Price.
The chart summarizes all these indicators and shows us that in previous cycles, from 2014 to the present, the fact that all indicators together have reached such extreme levels of oversold occurred on only 13 out of 4,360 trading days (0.2 percent). In practice, this very rare occurrence has occurred in only two previous events, January 2015 and March 2020 (green vertical lines).
The rarity, thus the relative "improbability" of this situation, increases suspicions of an intentional manipulation component in this bear market ending.
But let's see what the analysis done by Glassnode on long-term holders tells us...

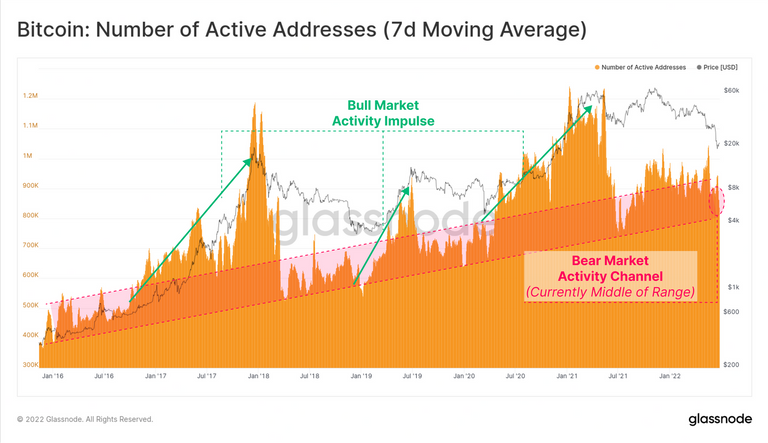
This chart simply shows the current situation as it is.
At the current listing, only the addresses of long-term holders remain active (the number of active addresses falls within the dashed channel indicating the minimum address base that remains in bear markets).
Thus, as we said, the large BTC accumulators remain the sole masters of the market.

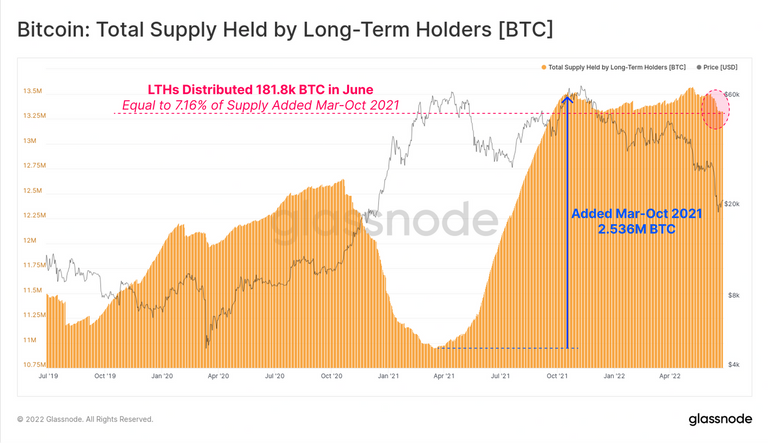
In contrast, this graph directly measures the value of deposits held by long-term holders (yellow mass).
The dotted circled area shows that in the last price drop there were sales by these holders as well.
Since these holders rarely get rid of their coins at lows, I hypothesized that these unusual sales may have been partly intended to create extreme bearish conditions (thus manipulating the market by steering it toward capitulation).

So if we have seen that these holders have remained the sole masters of the market, it is necessary to monitor their behavior to understand where they want to go (do they want complete market destruction or just capitulation?).
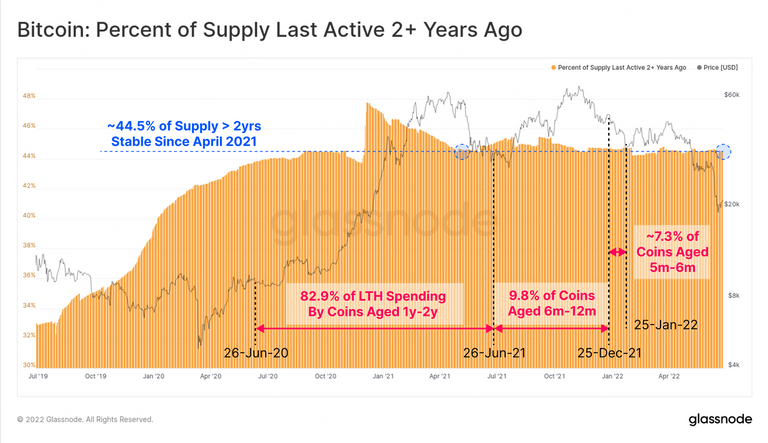
To help us better understand the nature of these unusual sales, the graph establishes whether "old" holders, i.e., those who started investing before 2020, also contributed to them, or almost only "young" holders who started investing in the current 2020-2022 cycle.
The graph shows that "older" holders (active for more than two years) have kept their deposits intact (the yellow mass remains flat and has not tilted downward).
Other graphs, which I omit, indicate that most of the selling was done by holders active one and two years ago.
Glassnode's conclusion is thus that we are facing a normal capitulation in which there is a loss of motivation only in the "younger" groups of holders.
On the other hand, my interpretation is broader: it may be that this was a normal capitulation, or, in part, also a downward manipulation is done by institutional holders, who, as we know, started investing just in the last two years.
In this final bear market phase, therefore, it becomes important to continue monitoring the behavior of the holders to understand where they want to go (do they want a complete destruction of the market or just a capitulation?).
Therefore, one of the indicators we will have to follow will be the one shown in the penultimate chart "Total Supply Held by Long Term Holders": if the yellow mass in the chart tends to fall further, we will have to admit that the holders are going well beyond the "normal" limits of previous bear markets, while if the mass goes back up, we will have the first signs that the market has found a limit to its descent.
SOURCES
https://insights.glassnode.com/the-week-onchain-week-26-2022/
Posted Using LeoFinance Beta

