In the last blog Zooming out on Bitcoin: Downfall of the Pi cycle I expressed my critic view about the Pi-based moving averages on BTCUSDT pair.
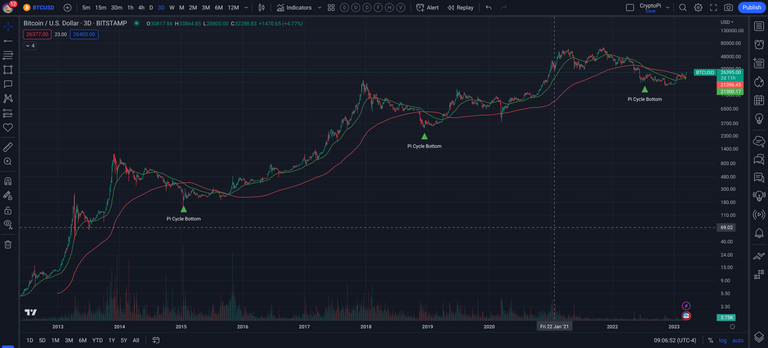
Since then the market has seen crazy ups & downs! So let's plot Pi-cycle top & bottom indicators on bitcoin on TradingView. As we are in a bearish trend, let us first looking at the Pi-Cycle bottom indicator, it is clear that the indicator failed to identify the bottom. The crossover of the moving averages happened far too early. It has however been able detect bottom in the previous market so it is 2 out 3 wins 😉

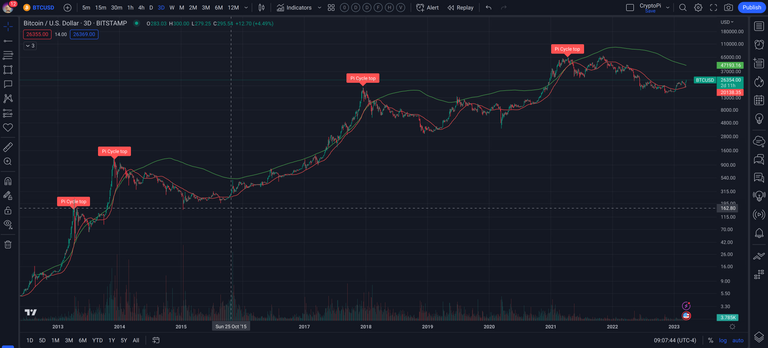
When it comes to market tops, I would give it a win for identifying the peak at ~60K levels. The price dropped significantly after the top. So far the top indicator has scored 4 out 4 times. 👑

If we look closely to the uptrend of the last days, the price has bounced back exactly from the support at the short moving average (red). A similar behavior was seen in the past cycles. Does it mean we are back in the Bull cycle? Well, that is difficult to say given that the macro factors are still heavily bearish. The cPI print today was 6.0%, therefore FED will not pivot on rate hikes. If bitcoin comes out sucessfully out the current & potential recessionary environment, it will be one of the best commodities available out there.
Wish you an amazing Pi-day!
@cryptopi314
Deutsch (Übersetzt mit www.DeepL.com/Translator (kostenlose Version))
Im letzten Blog Zooming out on Bitcoin: Untergang des Pi-Zyklus habe ich meine Kritik an den Pi-basierten gleitenden Durchschnitten des BTCUSDT-Paares zum Ausdruck gebracht.
Seitdem hat der Markt verrückte Aufs und Abs erlebt! Lassen Sie uns also die Top- und Bottom-Indikatoren des Pi-Zyklus für Bitcoin auf TradingView darstellen. Da wir uns in einem Abwärtstrend befinden, schauen wir uns zunächst den Pi-Cycle Bottom-Indikator an. Es ist klar, dass der Indikator den Boden nicht identifizieren konnte. Das Kreuzen der gleitenden Durchschnitte erfolgte viel zu früh. Er war jedoch in der Lage, den Boden im vorherigen Markt zu erkennen, so dass es 2 von 3 Siegen gibt 😉 .

Wenn es um Marktspitzen geht, würde ich ihm einen Sieg für die Erkennung der Spitze bei ~60K geben. Der Kurs ist nach dem Hoch deutlich gesunken. Bislang hat der Top-Indikator 4 von 4 Mal gepunktet. 👑

Wenn wir uns den Aufwärtstrend der letzten Tage genau ansehen, ist der Kurs genau von der Unterstützung am kurzen gleitenden Durchschnitt (rot) abgeprallt. Ein ähnliches Verhalten war in den vergangenen Zyklen zu beobachten. Bedeutet dies, dass wir uns wieder in einem Bullenzyklus befinden? Nun, das ist schwer zu sagen, da die Makrofaktoren immer noch stark rückläufig sind. Der Verbraucherpreisindex lag heute bei 6,0 %, weshalb die FED keine Zinserhöhungen vornehmen wird. Wenn bitcoin erfolgreich aus dem aktuellen und potenziellen rezessiven Umfeld herauskommt, wird es einer der besten Rohstoffe sein, die es gibt.
Ich wünsche Ihnen einen tollen Pi-Tag!
@cryptopi314
The above content is for educational purposes only. It is not a financial advice.
Der obige Inhalt ist nur für Bildungszwecke. Es handelt sich nicht um eine Finanzberatung.
Source: Images
Post Image
Additional reference:
- Silicon Valley Bank and its effect on the crypto market
- DeFiLlama: A Llama in the living room!
- Wall Street Cheat Sheet on Crypto
- FED has spoken! Market will face QT
- Tools & Resources: TradingView
If you find the content useful, kindly consider to follow and re-blog! It is a great motivation 🤗
Wenn Sie den Inhalt nützlich finden, denken Sie bitte daran, zu folgen und zu rebloggen! Es ist eine große Motivation 🤗.


