Bitcoin: a long way to bull-run
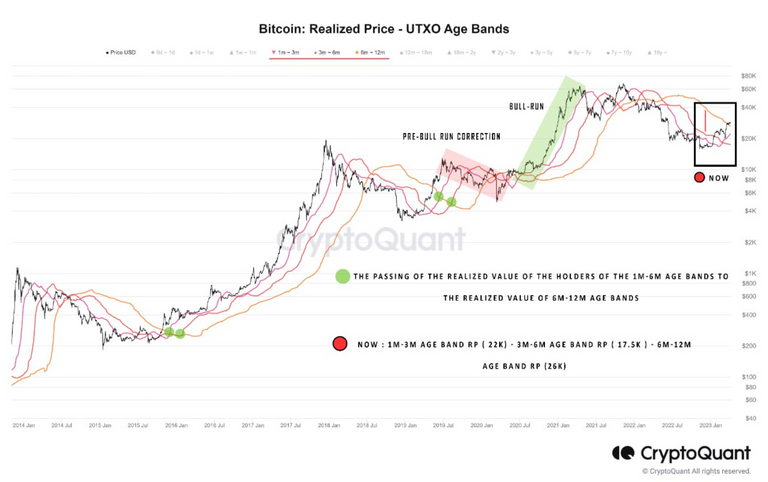
"Based on the Bitcoin price cycle in 2015-2016 and 2018-2019, when the 1m-6m age bands' realized price value passed the 6m-12m age bands realized price, after the pre-bull run price correction, the bull run began." - CryptoQuant
Here, the realized price crossovers of multiple monthly bands identified as either we are entering a new bull-run, pre-bull run or yet another long accumulation range play. I discussed in one of the previous posts the possibility of streched Wyckoff accumulation. If CryptoQuant analysis turns to be true, it is in sync with Wyckoff Accumulation as well as long-term Macro-factors.
Hier zeigen die realisierten Preisüberkreuzungen mehrerer monatlicher Bänder, dass wir entweder in einen neuen Bullenlauf, einen Pre-Bullenlauf oder eine weitere lange Akkumulationsphase eintreten. In einem der vorherigen Beiträge habe ich die Möglichkeit einer gestreckten Wyckoff-Akkumulation diskutiert. Wenn sich die CryptoQuant-Analyse als wahr erweist, ist sie im Einklang mit der Wyckoff-Akkumulation und den langfristigen Makro-Faktoren.
Best regards
Herzliche Grüße
@cryptopi314
The above content is for educational purposes only. It is not a financial advice.
Der obige Inhalt ist nur für Bildungszwecke. Es handelt sich nicht um eine Finanzberatung.
Source: Image
Additional reference:
- Is Wyckoff being played out on BTC weekly?
- NOSTR: Where does it stand?
- Is Gold profitable?
- Mindful and fruitful HIVE Meetup
- TradingView: Tools & Resources: TradingView
If you find the content useful, kindly consider to follow and re-blog! It is a great motivation 🤗
Wenn Sie den Inhalt nützlich finden, denken Sie bitte daran, zu folgen und zu rebloggen! Es ist eine große Motivation 🤗.
