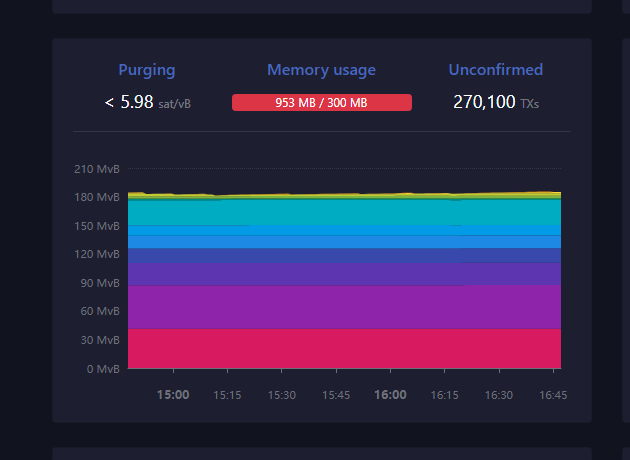
In the first half of 2023, the Bitcoin network has experienced an increased number of transactions and fees. The network was congested at times with a record high of transactions stuck in the mem pool.
This increased number of transactions has come from the Ordinals protocol that enables NFTs on Bitcoin. This was then pushed further to create tokens on the Bitcoin network.
Bitcoin NFTs are represented by one satoshi. The smallest Bitcoin denominational unit on Bitcoin. Each satoshi is unique and has its number. Then ordinals protocol is used to inscribe a text on the satoshi. This text can be used to generate a low resolution image. After the Satoshi is inscribed with the text, then it can be transferred buy/sold as an NFT. Inscriptions are made only by the ones running a full bitcoin node.
More info about the Ordinals project and Bitcoin NFTs in the posts from Forbes and NFTNow.
It is sufficient to say that NFTs on Bitcoin have caused a lot of controversy as the Bitcoin purist are not a fun of them.

With this said let’s take a look at the Bitcoin network data, and how have these Bitcoin NFTs impacted the network.
We will be looking at:
- Total number of wallets
- Active wallets
- Hash rate
- Number of transactions
- Fees
The data presented here is mostly gathered from the blockchains charts.
Number of Wallets
Here is the chart for the total number of Bitcoin wallets created.

Bitcoin stands at 87M wallets now.
When we zoom in 2022-2023 we get this:

At the begging of 2022 there were more than 40k wallets created daily. These numbers have dropped since then and the low was somewhere in August 2022. Since then, the number of new Bitcoin wallets is around 5k daily. This has been the number in 2023 as well with no significant ups or downs.
The yearly chart for new bitcoin wallets
The chart for the number of new Bitcoin wallets per year looks like this.

We can see that the ATH for new wallets is in 2020 with around 19M Bitcoin wallets created in that year. In 2021 there is almost 17M bitcoin wallets created, while in 2022 we have 5.5M new wallets.
The slow down in new wallets creation is obvious. Will see how will 2023 ends but it is quite low for the first five months with 1M wallets created.
Active wallets
How many of the are being used?
Here is the chart.

The record high numbers for active Bitcoin wallets per day was reached in December 2017 with almost 1M active Bitcoin wallets. A sharp drop in 2018 to the 400k daily active wallets, and a steady growth since then.
When we zoom in 2022 - 2023 we get this:

A very steady number with around 700k active wallets. The drop in the price didn’t impacted this chart at all.
There has been a recent uptick in the numbers of active wallets going up to 800k for a short period of time.
Transactions
The activity on the network is mostly represented by the number of daily transactions.

This is where most of the change in activity is visible on the bitcoin network.
A spike in the number of transactions from under 300k per day to almost 700k per day in 2023. A new ATH for the number of transactions.
When we zoom in 2022-2023 we get this:

This chart is the most telling about the impact that the Bitcoin NFTs have on the network.
We can see that the increase in the number of transactions reached its peak in May, and has slowly going down since then. The numbers of daily transactions is now in the range of 400k to 500k per day, that is still high when compared to the 250k in the previous year.
Hash Rate
The ultimate Bitcoin value is the network stability and security. The network security in a proof of work chains is measured in hash rate, or how difficult is to mine. The bigger the completion, the higher the hash rate.

Almost constantly going up with few dips here and there. The most significant dip happened in the summer of 2021 when China banned mining. We can see yet another one just happened recently at the end of 2022, but recovered since then and continue to grow massivle to another ATH for the hash rate.
We are now at It almost hit 370M TH/s and growing.
Fees
A bit unpopular topic the fees.

There has been an overall downtrend throughout 2022, and then a huge spike in May 2023. For a few days the fees on the Bitcoin network were above $20 per transaction. They have come down in the recent weeks but are still around $5.
Hash Rate VS Price
When we plot these two together, we get this.

Even with the recent dip in the Hash rate the overall picture is still up. The hash is now at 370M TH/s. Almost invers correlation between these two, showing that the miners are quite resilient.
At the end the chart for the Bitcoin yearly candles on logarithmic scale:

All the best
@dalz
Posted Using LeoFinance Alpha


