HIVE/USDT

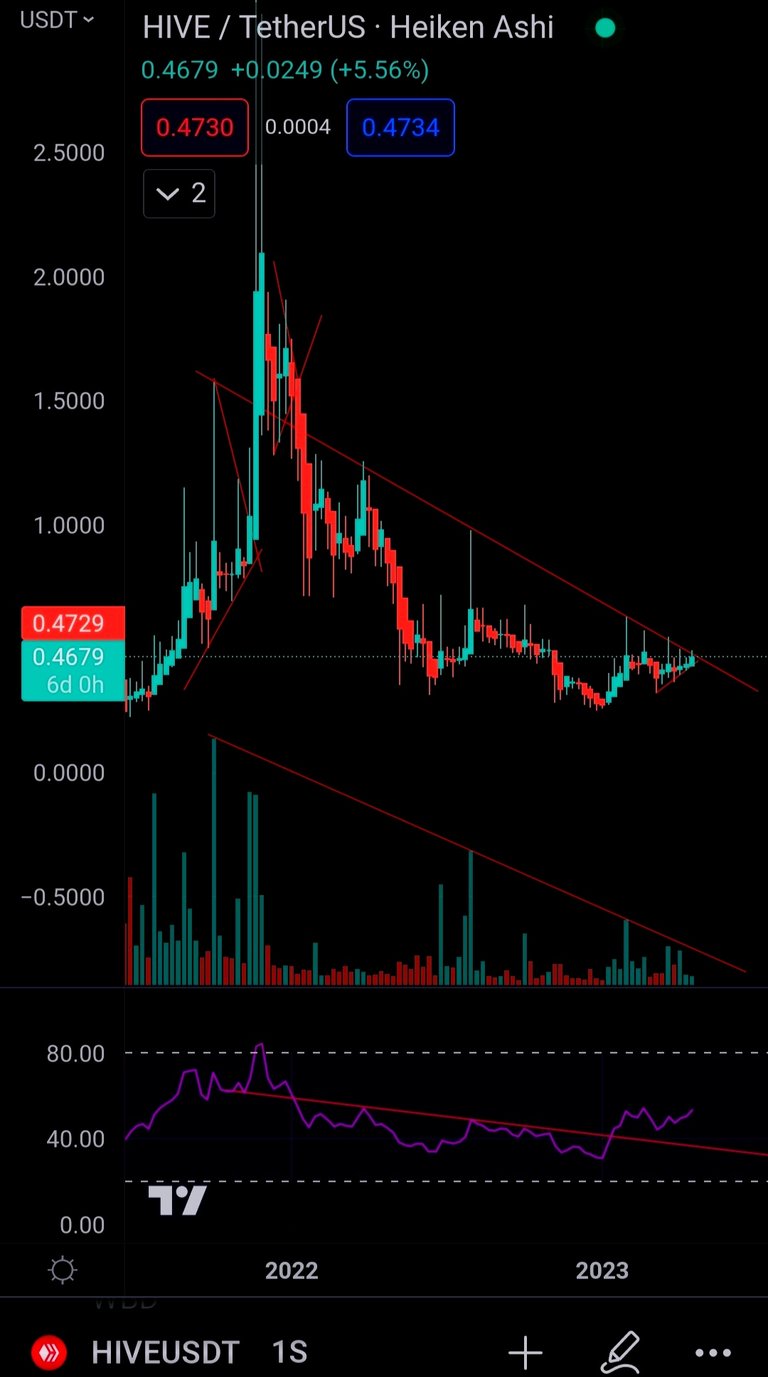
Yo, hive about to break out weekly descending trendline... Not relevant volume yet... I expect to see price action trend from here, normally we see a zone retest for confirmation, so...
We saw mommentum indicator breaking same diagonal line, which is bullish signal too to see the trend direction... Yeah, you can draw figure patterns or s/r lines on mommentum like in obv too.
Actually each chart will behave different, so you kinda need to be able to track their own patterns, and what time period normally their moves takes, which is also a pattern...
Anyway, breakout would be better with ascending volume... I'll keep updating this post with what happens next, so I can also track my analysis for an overloop feedback...
Edit: (yeah, Im actually updating)

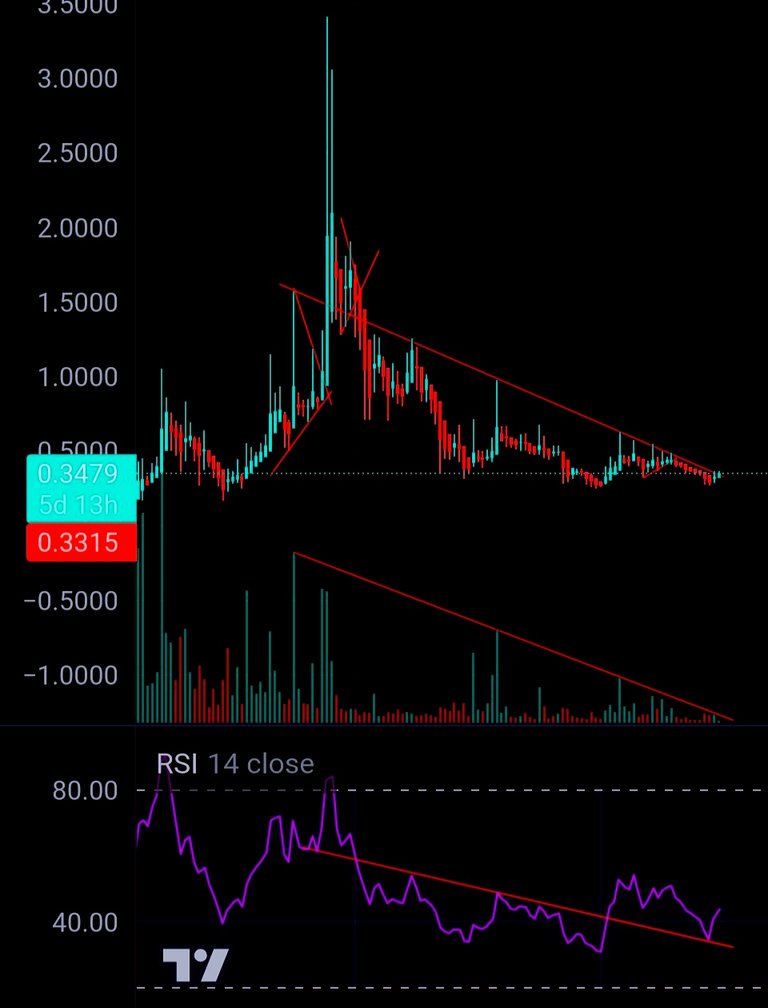
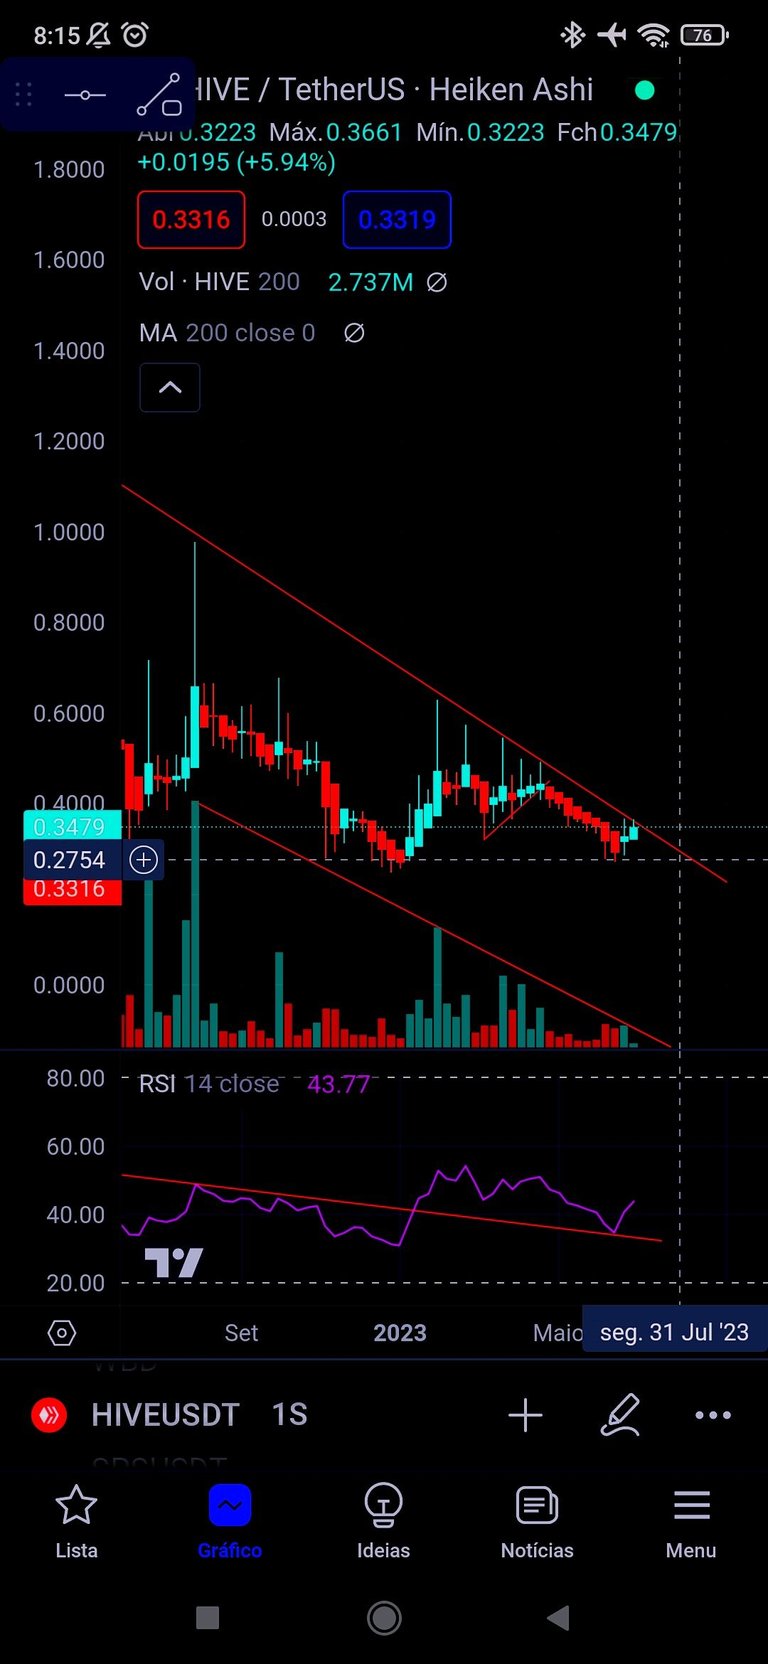
So, its crazy, the correction stayed aligned to the downtrend line during these weeks, and its starting to form bullish weekly candles, even though there is no space anymore in the chart pattern (that can resume until end of July), while we are not seeing volume yet to carry mommentum. Looks like this is crypto accumulation behavior for hive...

In the previous mini intraday hive simetrical triangle, there was a short term breakout to the downside, even in the first chart I had this line drawn, but I notice it would be a mid term correction, and it formed a descending triangle pattern with the long term downtrend line (which is a bearish pattern), but by previous prices behaviors could say it looks cheap asf, good accumulation zone even if a bear trap happens, cause it could also just trend from here.


