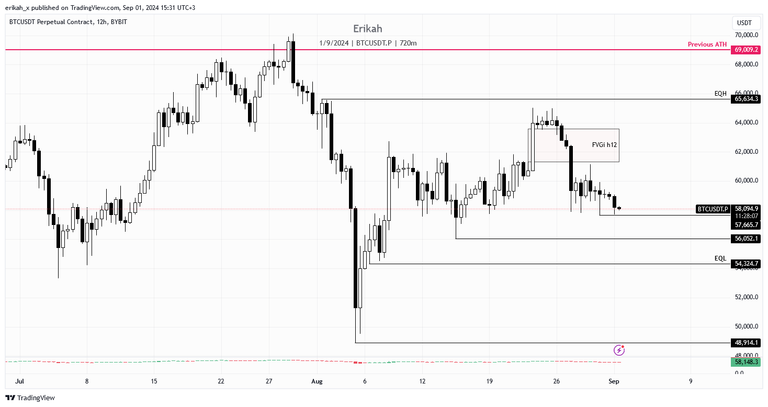
Last week I finished my analysis with a $BTC chart and expressed my concern, regarding a bullish fair value gap (FVG), that could draw price as it serves as internal liquidity.
This is the H12 chart on $BTC. So far, price is holding nicely for two days in a row, after the nice expansion we had on the 23th. This is good, but the FVG below is known as internal liquidity and there's a chance price could come back to rebalance it. I don't want to complicate it with mentioning BPR and so on, but if a rebalancing attempt will happen, it's going to affect $HIVE as well. Time will tell. source
That was the FVG I was talking about last week, which in the meantime has been rebalanced and unfortunately could not hold price. Now it is a bearish FVG and acts as resistance.
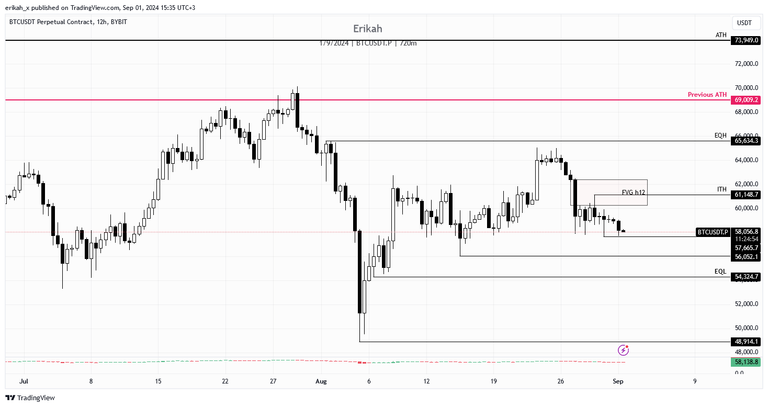
As that FVG has been rebalanced and price has created a new one, it is not relevant for me anymore. Right now we have another bearish FVG that is capping the market. Price had two attempts to rebalance and invert it already this week, both failed. So as long as price stays below the FVG, we can's speak about continuation.
Why I'm saying this? Because this drop has affected $HIVE as well and most, if not all the alts. So let's see what $HIVE has done lately.
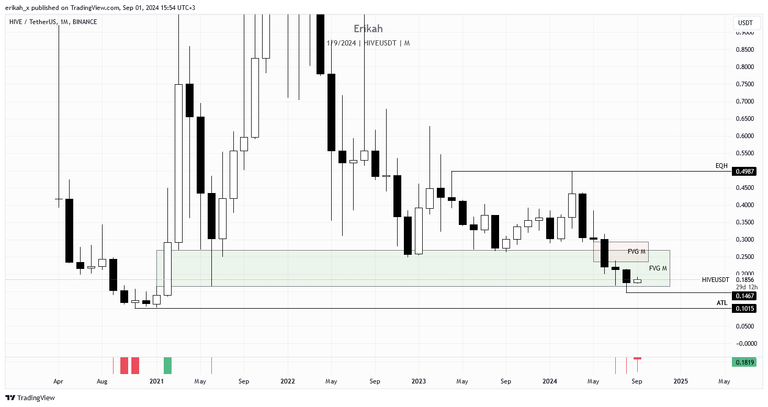
Yesterday the monthly candle closed and unfortunately we registered a bearish candle. The good news is, the candle closed inside the bullish FVG and not under it, in which case that green FVG would have been transformed it in resistance.
We had five bearish candles in a row the last five months. Two of them can be considered doji as these have small bodies, indicating indecision, but because are flanked by bearish candles, I consider them bearish. It's too early to say what's going to happen this month, so let's see the weekly chart next.
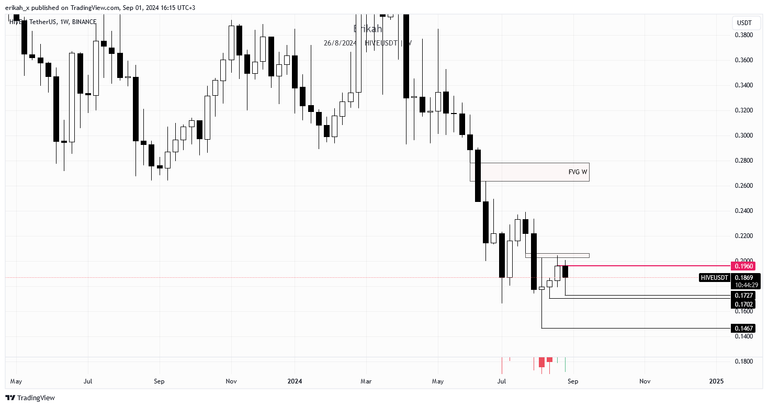
The weekly candle still has about ten hours till close, but as of now, it is a bearish candle. There's a bearish FVG (marked with red on the chart), that rejected price last week. This weeks candle has a long downside wick, which means buyers stepped in and pushed the price higher, but for a bullish continuation, price needs to close above that slim FVG, which means above $0.2061. Otherwise the next liquidity pool is at $0.1702 and $0.1467.
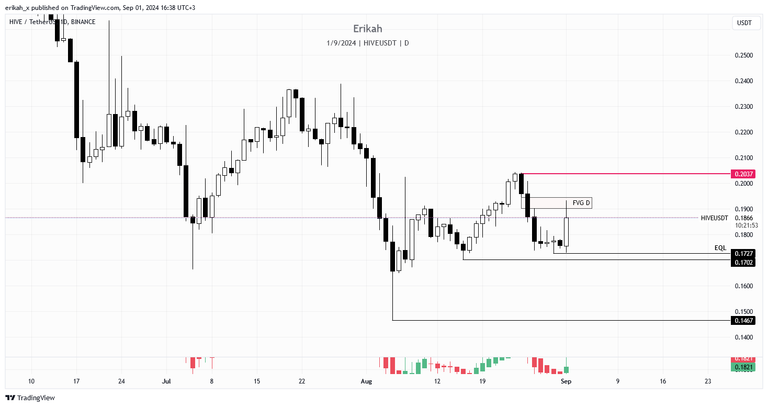
The daily chart looks a bit better and more promising. Obviously the daily candle is not closed, there are ten hours till we see the close, but I love the momentum the daily candle has today. So far it looks like the bearish FVG (marked with red on the chart) is rejecting price, but again, till the candle close, nothing is certain. Should the candle close above the FVG, we can expect bullish continuation. The upside looks quite nice, no gaps to reject price.
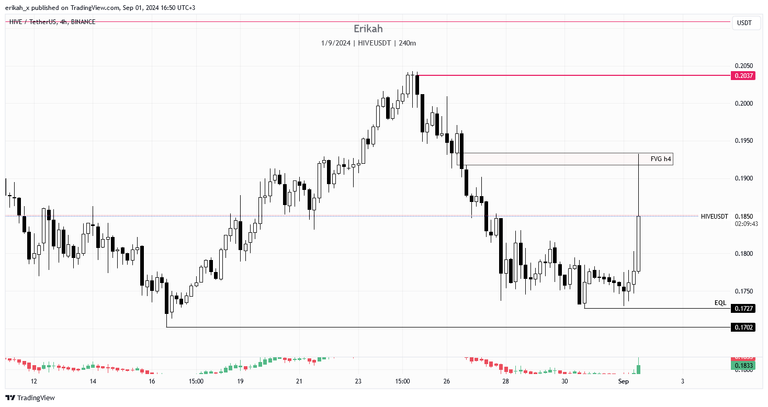
This is where things are starting to get interesting. This is the h4 chart. Look at that candle and the upside wick. Today it's Sunday, usually weekends are known to be slow ans there's no volatility, but $HIVE is a different animal. I keep saying that ans the chart proves it. There are two hours still this candle closes, but at the moment of writing,it looks like that bearish FVG (marked with red) rejected price for now. Liquidity was swept up to the FVG and buying pressure is dropping.
I'm really curious to see where the candle is going to close at. By the look of it, I think we're going to get a huge wick and a small bodied candle, but at the end of the day, it doesn't matter what I think. What matters is the chart.
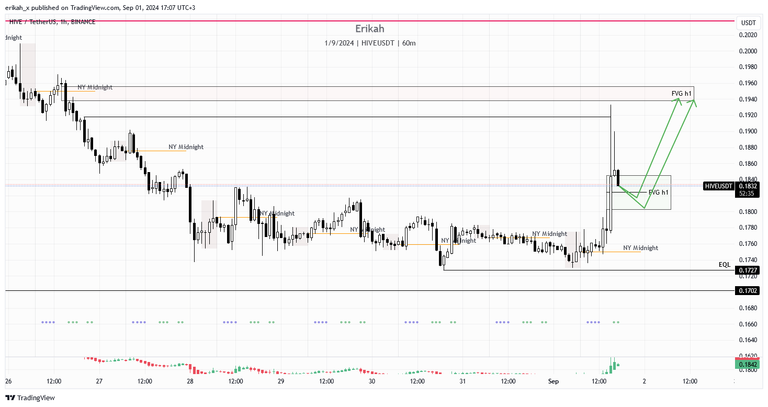
On a more granular scale, the h1 chart gives me more clarity. For me, the ideal scenario would be the on I drew on the chart. meaning I'd like to see price come back to the midline of the FVG and then reverse, close above it and have a second attempt at reverting the bearish FVG above. Or, rebalance the FVG completely, going close to the bottom of the box, then reverse and revert the bearish FVG above. If we close below the Bullish FVG price is in right now, chances are price will revisit the lows below.
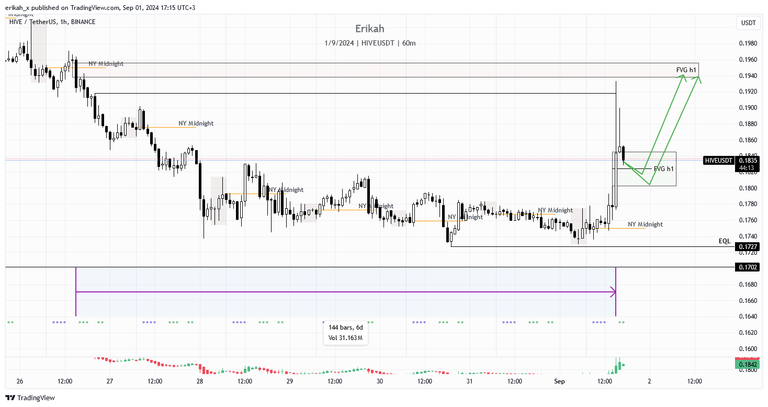
The funny thing here is, it took price one week to get from today's high to today's low and took basically one candle to sweep all the upside liquidity price left on its way down.
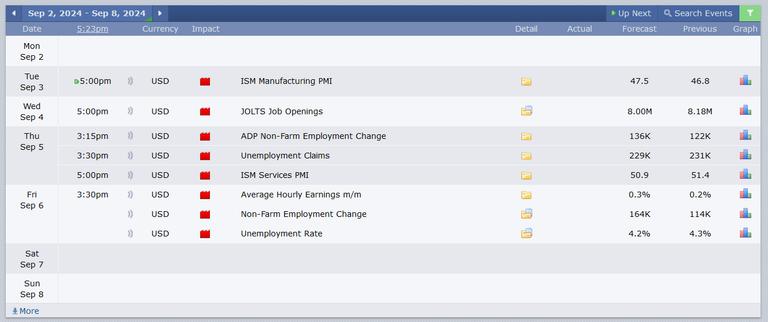
Looking at the economic calendar, next week will definitely not be boring as we have four red folder news days. I'm expecting volatility and manipulation as always, which is not always bad, you just have to adjust your trading strategy and apply proper risk management, in order to protect your capital, which should be your no. 1 priority.
As always, this is a game of probabilities, not certainties. Also please note, this is not financial advice, it's my view and understanding of the market.
All charts posted here are screenshots from Tradinview.
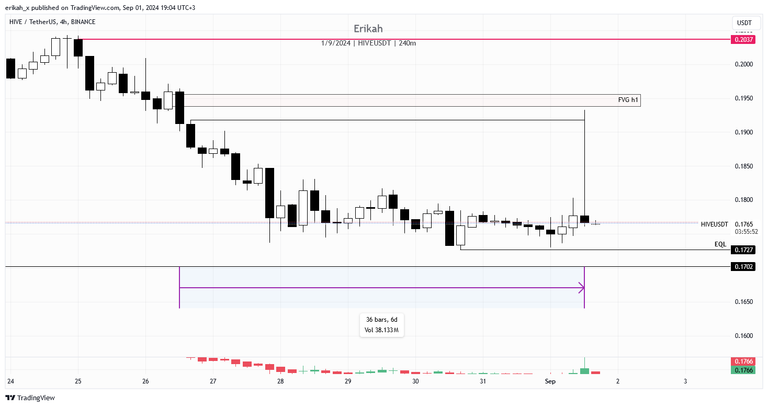
Later edit: and this happens when the h4 candle closes. Need I say more? I don't think so.

If you're a newbie, you may want to check out these guides:
- Communities Explained - Newbie Guide
- Cross Posting And Reposting Explained, Using PeakD
- Hive Is Not For Me
- How To Pump Your Reputation Fast - Newbie Guide
- Tips And Tricks & Useful Hive Tools For Newbies
- More Useful Tools On Hive - Newbie Guide
- Community List And Why It Is Important To Post In The Right Community
- Witnesses And Proposals Explained - Newbie Guide
- To Stake, Or Not To Stake - Newbie Guide
- Tags And Tagging - Newbie Guide
- Newbie Expectations And Reality
- About Dust Vote And Hive Reward Pool, by libertycrypto27

