I hope you missed my technical analyses post and are anxious to read about what's been happening with our beloved token 😆 Ok, jokes aside, it's Sunday again, so let's dive into it, get prepared to what's coming next week.
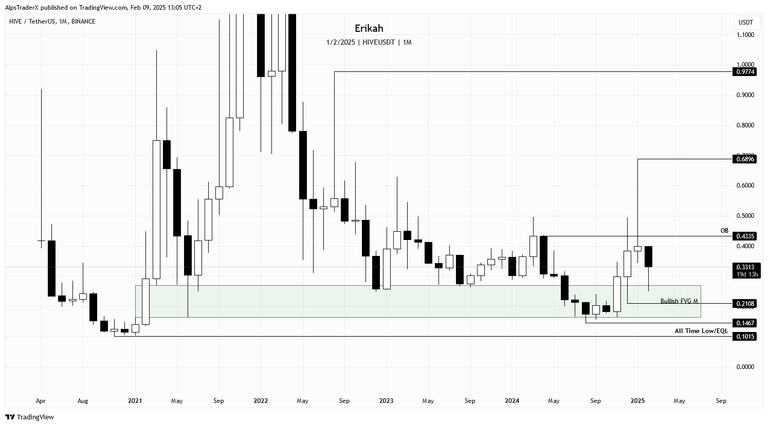
On the monthly time frame, we got the retest of the bullish fair value gap (marked with green), which is holding price since the beginning of 2021. Price wicked down into the gap, bounced off nicely, but at the time of writing, still looks heavy. We'll see what happens in the next three weeks, at the end of the month, when the candle closes.
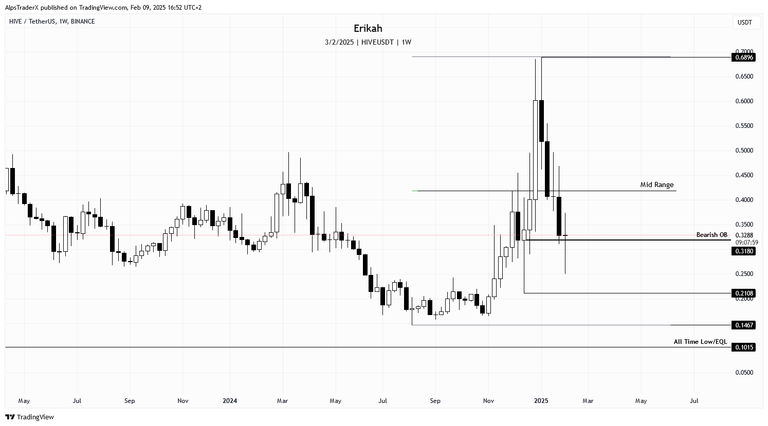
The weekly chart is a bit flat. Price failed to close above the order block at $0.435. Right now we have a doji, which means indecision, but should price close below $0.318 means confirmation of a bearish order block. We have still 9 hours till candle close, anything can happen.
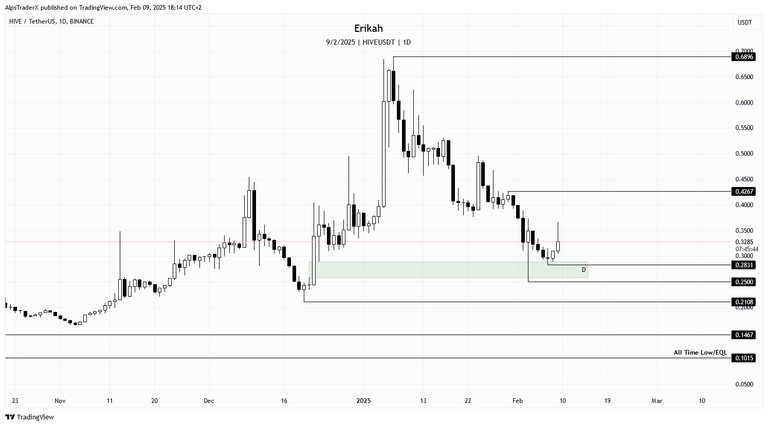
The daily chart looks promising for now. Price rebalanced the bullish gap (marked with green) on Monday, bounced off and came back to retest it again on Friday. So far this gap managed to hold price nicely.
The daily candle closes in 7 hours, but so far it's a bullish candle. What I don't like is the long upside wick, which means price tires, but failed to stay at that level. Levels to watch is $0.4267 on the upside, above the swing high, or price could retest the gap again, in which case the swing low at $0.2831 is the next liquidity pool. If the gap can't hold price, then I'm looking at $0.25 and ultimately at $0.2108.
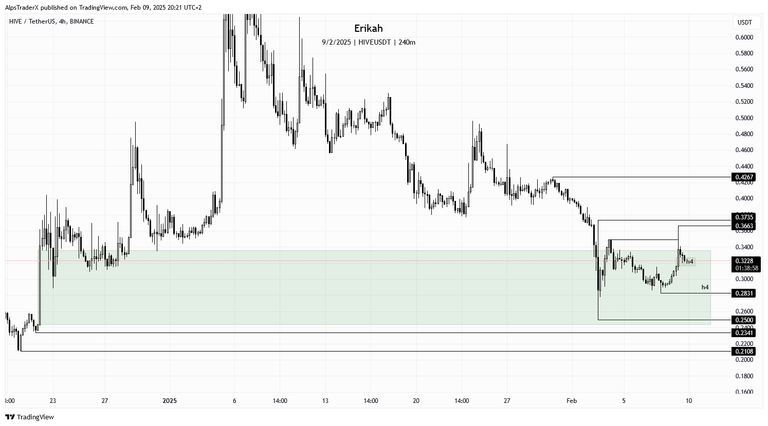
The h4 chart looks interesting. Price is inside an old bullish fair value gap, that was created on the 22th December last year and has not been rebalanced till this month. On February 3rd most of the gap was rebalanced, price managed to close above it, but then came back inside it again.
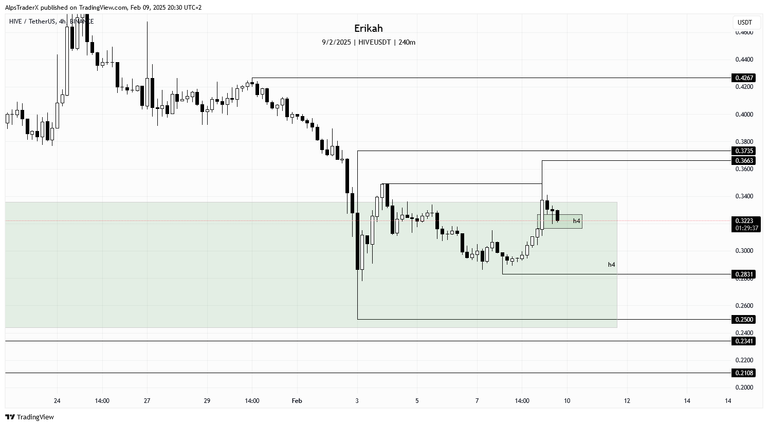
Earlier today we saw a move to the upside, which resulted in liquidity sweep up until $0.3663, but lack of buying pressure cased price drop.
Zooming in a little, you can see there's another gap on the buy side, which is revisited now by price and should hold price. Even though on high time frame price looks heavy, on a more granular scale this is still bullish.
For bullish continuation, price needs to close above both gaps. Should the gap hold price, the next level to be swept is $0.3663 and $0.3735 after that.
If the gap can't defend price, I'm looking at the next swing low at $0.2831 to be swept next.
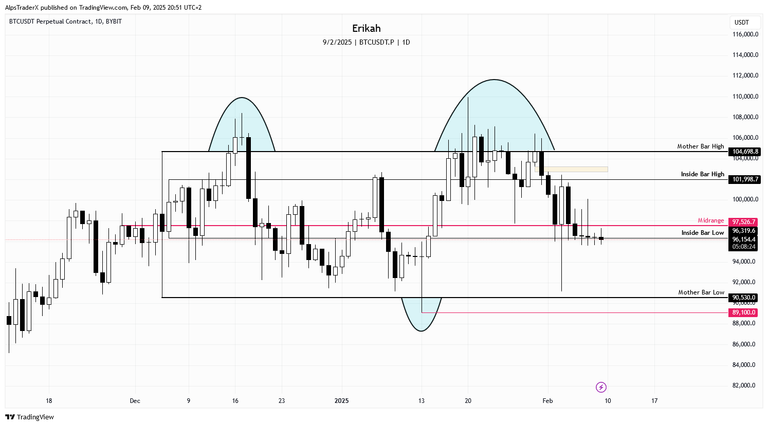
$BTC is back into the inside bar pattern, price is sitting on the inside bar low.
If you look at the historical data, weekends tend to either generate doji candles, or we get some drops which means bearish candles. This weekend we got two doji candles, which means indecision in the market, but it's not surprising as traditional markets are closed.
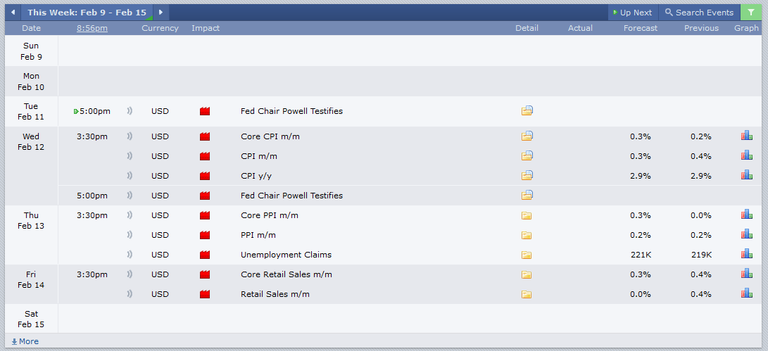
The economic calendar is promising for next week. We have four red folder news days and most of the days are going to bring volatility. Tuesday Powell's speech will move the market for sure, after which Wednesday is going to bring some fireworks as well as Core CPI is crucial.
Remember, technical analyses is not about forecasting the price, but about reacting to what price does.
As always, this is a game of probabilities, not certainties. Also please note, this is not financial advice, it's my view and understanding of the market.
All charts posted here are screenshots from Tradinview.

If you're a newbie, you may want to check out these guides:
- Communities Explained - Newbie Guide
- Cross Posting And Reposting Explained, Using PeakD
- Hive Is Not For Me
- How To Pump Your Reputation Fast - Newbie Guide
- Tips And Tricks & Useful Hive Tools For Newbies
- More Useful Tools On Hive - Newbie Guide
- Community List And Why It Is Important To Post In The Right Community
- Witnesses And Proposals Explained - Newbie Guide
- To Stake, Or Not To Stake - Newbie Guide
- Tags And Tagging - Newbie Guide
- Newbie Expectations And Reality
- About Dust Vote And Hive Reward Pool, by libertycrypto27
