It's been three weeks since my last technical analyses post. I know, shame on me, but with Christmas and New year, and other things that happened in my real life, honestly I had no time. So it's just about time to have another post out.
Since my last post, $HIVE got listed as perp futures on a a bunch of exchanges, which moved things a lot, but that is a different story, for another post, which is coming next week, so stay tuned.
Before I start my analyses, I need to note that I'm still using the spot chart on Binance, because none of the perp charts have enough historical data. It'll take some time till I can use those for higher time frame, but we'll get there one day.
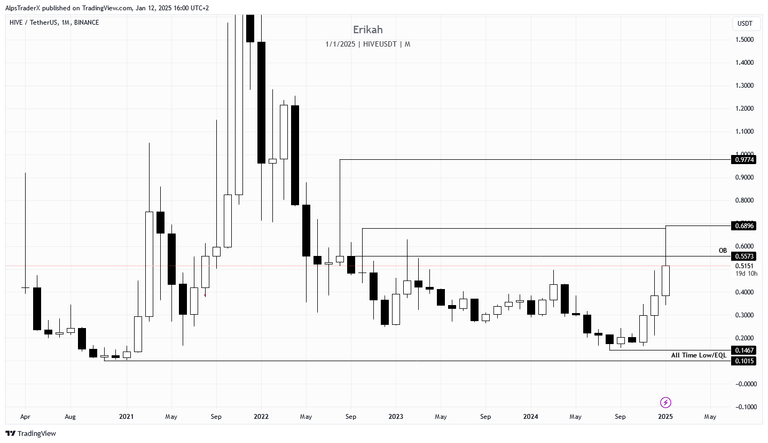
Let's start with the monthly chart, as always, even though there are still almost three weeks till the candle close.
January is the third months we get a bullish candle (so far). At the time of writing, price swept liquidity at $0.6896 level and it is below the monthly order block (OB). For bullish continuation, price has to close above the OB, at $0.5573 and hold, but again, there are still almost three weeks. Price action is pretty balanced in both direction, so there's not much to stop price.
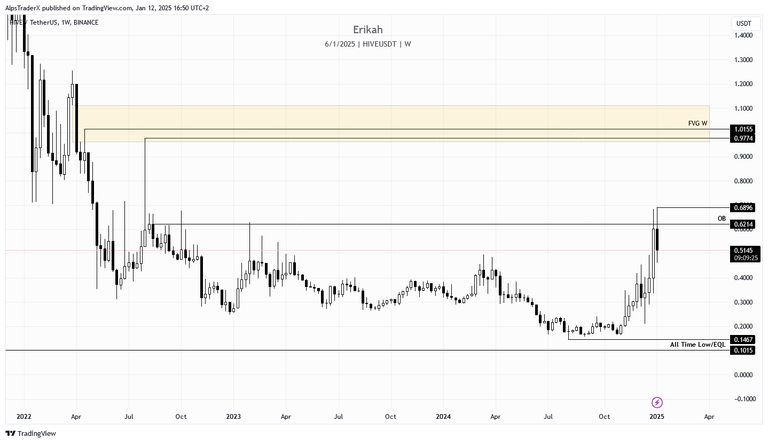
The weekly chart shows that so far price is below the weekly order bloc. There are still nine hours to go, till the weekly candle close, and if nothing major happens (which I don't see it will), we are going to get a bearish candle, with a long upside wick and a close below the OB. There's no reason for concern, there's nothing wrong with that, it's quite healthy actually and you'll see why on a lower time frame chart I'm going to show you below.
However, for bullish continuation, price needs to close above the OB ($0.6214), then the next liquidity pool is at $0.6896. In case of a strong expansion to the upside, I'm expecting price to sweep $0.9774 and $1.0155, then correction, as there's a bearish gap at that level which can reject price.
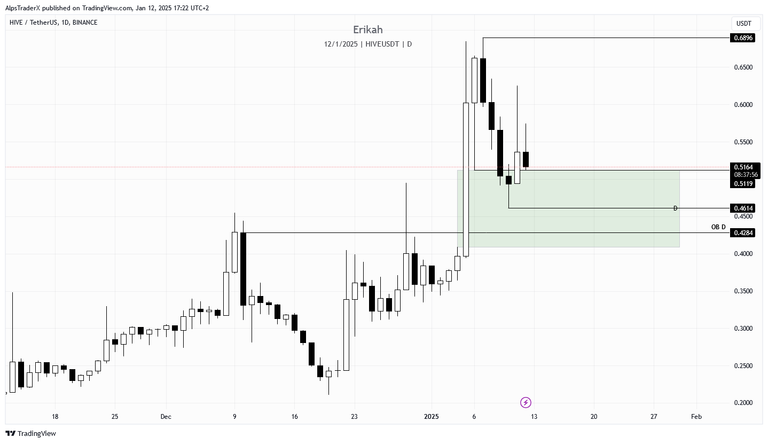
On a daily scale, price came back to retest the gap (marked with green on the chart)that was created last Sunday and closed above it yesterday. Today's candle is not close yet, but at the time of writing it is still above the gap and if it closes above $0.5119, we can expect bullish continuation to the upside.
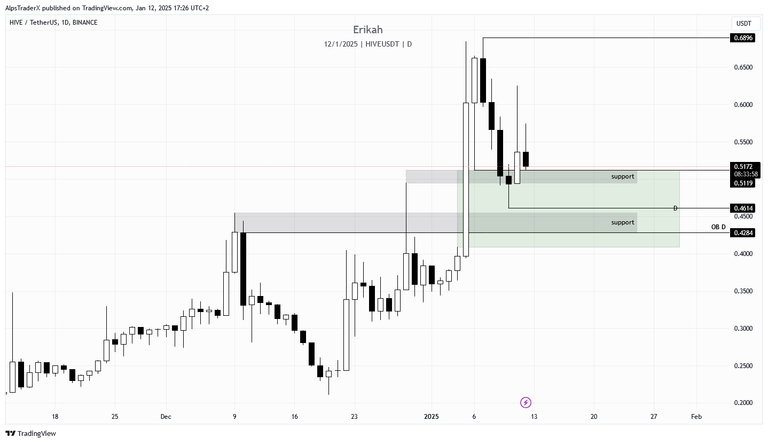
I'm trying to simplify my chart, to avoid confusing you, but for those who are not familiar with reading charts, maybe showing these support levels is better from a visual point of view.
If price closes below $0.5119 and loses the grey box, which is support, there's a chance to sweep liquidity below $0.4614. There's another level of support between $0.4284 (which is the top of the daily OB as well) and $0.455, which must hold price.
To simplify all that, I don't mind price wicking down to $0.4098, that would be a healthy move to rebalance the gap and better now than later, but it has to bounce there and close above $0.5119 for bullish continuation.
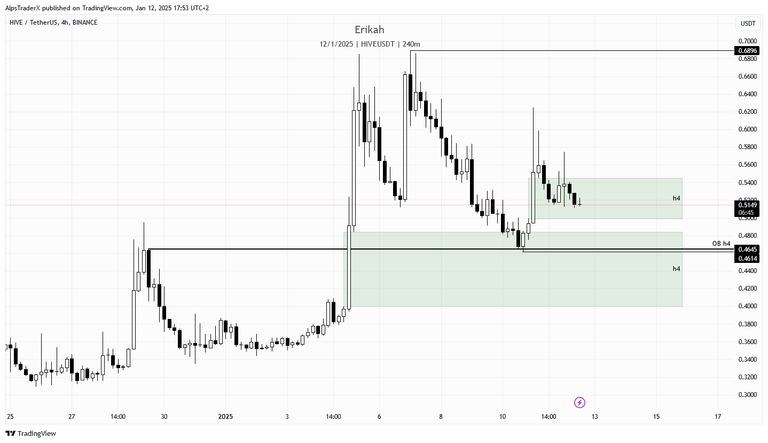
On a more granular scale, the h4 chart shows price is inside a bullish gap (marked with green on my chart) at the time of writing and looks a bit heavy to be honest. Obviously no one knows what's going to happen, but there's a possibility for price to close below the gap and go for the low at $0.4614, which is in confluence with the h4 OB. Nothing to be concerned about, it can still bounce there and have bullish continuation. If that level is lost, there's a possibility for price to go as low as $0.4048. Time will tell.

Let's have a look at what $BTC has been doing lately.
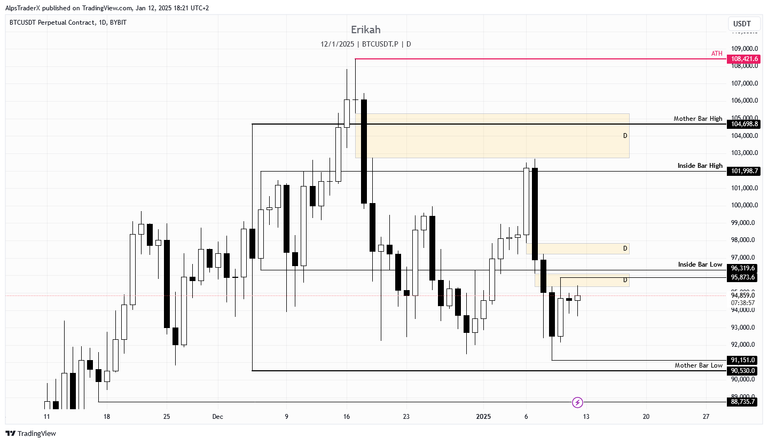
$BTC had an interesting journey so far. Although I'm not a pattern trader this Inside Bar Pattern on the daily chart works perfectly for now and you can see price is below the Inside Bar Low, and below the bearish gap that is capping the market at the time of writing. This is the second attempt to invert the gap, but it seems like rejection so far. We had, or have two small bodied candle the last two days, which signals indecision, but it's not a surprise as it's the weekend, traditional markets are closed and there's no economic event to move the market.
In case of bullish continuation, I'm expecting price to sweep liquidity from $95,873 level and close above $96,113. In case of rejection, I'm looking at 93,660 to be revisited, or even lower, $91,151 is possible.
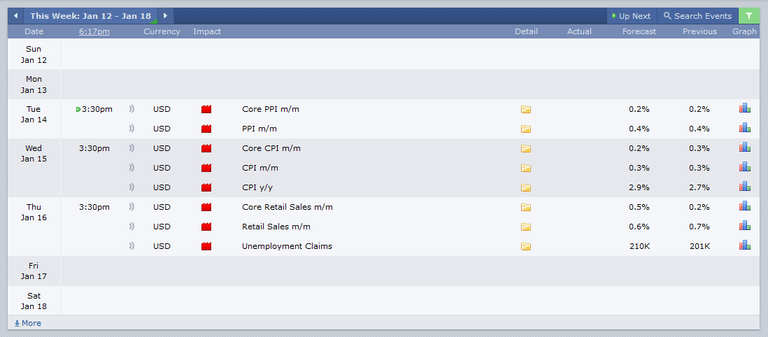
Next week we have 3 red folder news days and looking at the nature of data that will be announced, I'm expecting volatility and manipulations as well. Let's see if they miss these by a mile again.
This is all for this week's edition. As I mentioned at the beginning of my post, I'm going to write another post on how I see trading $HIVE perpetual futures.
As always, this is a game of probabilities, not certainties. Also please note, this is not financial advice, it's my view and understanding of the market.
All charts posted here are screenshots from Tradinview.

If you're a newbie, you may want to check out these guides:
- Communities Explained - Newbie Guide
- Cross Posting And Reposting Explained, Using PeakD
- Hive Is Not For Me
- How To Pump Your Reputation Fast - Newbie Guide
- Tips And Tricks & Useful Hive Tools For Newbies
- More Useful Tools On Hive - Newbie Guide
- Community List And Why It Is Important To Post In The Right Community
- Witnesses And Proposals Explained - Newbie Guide
- To Stake, Or Not To Stake - Newbie Guide
- Tags And Tagging - Newbie Guide
- Newbie Expectations And Reality
- About Dust Vote And Hive Reward Pool, by libertycrypto27


