Sunday means $HIVE and $BTC analyses for me, so let's do it, let's see what these two assets have been doing this week.
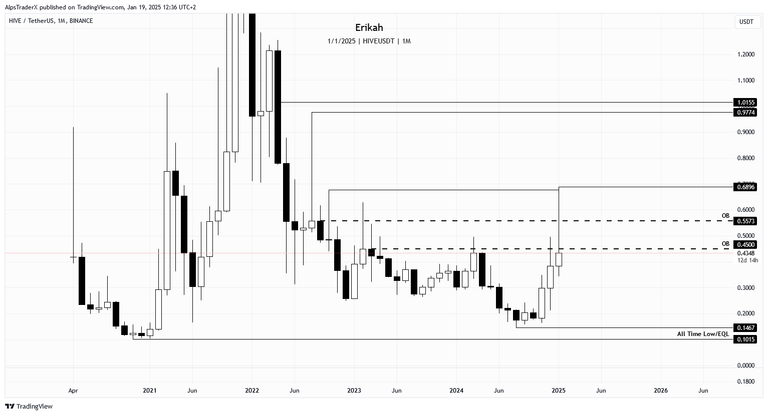
Looking at last week's analyses, at the monthly chart I said "for bullish continuation, price has to close above the OB, at $0.5573 and hold", because price was slightly below that level. That did not happen as we got a selloff so far, indicated by the huge upside wick. I'm not saying it was expected as no one knows what's going to happen, but given the fact that we had two consecutive bullish months previously, it can happen. Nothing to worry about as the month is not over yet, we started the second half of it now and there are almost two weeks till the candle close.
You may be wondering what we can expect next. Well, it's a bit tricky here, because price swept liquidity on the upside till $0.6872 and there are no gaps on the buy side (the leg up from the previous low), so all I can say is, if the monthly candle can close above $0.45, then we can expect bullish continuation and the next liquidity target is at $0.6872. Should price fail to close above $0.45, I'm looking at $0.1467 as the next liquidity pool, but honestly, I don't think that's going to happen now. There's a chance for price to consolidate a little in this area, then go higher, but I don't like to speculate, so let's wait and see.
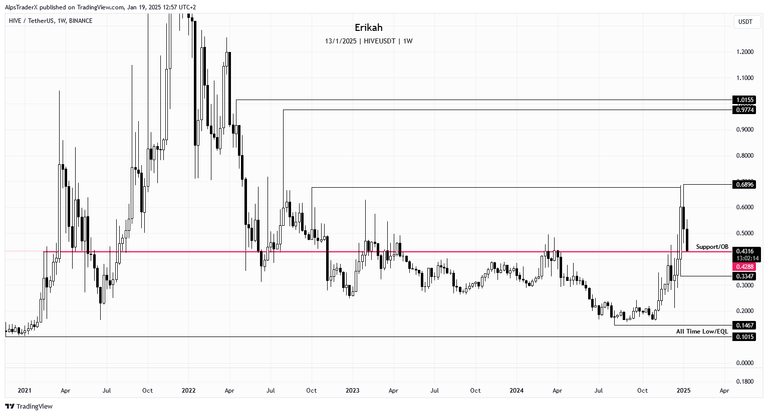
The weekly chart looks really interesting and even though the monthly shows a big selloff, I like the weekly and I'm going to show you why. At the time of writing, price is retesting support. This is not how I trade as I'm a scalper firs and mostly look for lower time frame, but in the current market conditions, having a broader understanding and view of the market is necessary, so I draw the support line back till February 2021 and you can see how many times this level has been tested as support and resistance, meaning price broke above it, then broke below it and became resistance and so on.
As I mentioned in the last week's analyses, $0.4284 is the top of the weekly and daily OB as well, which overlaps this level of support. As long as price can stay above this level, we can expect bullish continuation till $0.6872. If not, then I'm looking for $0.3347 to be swept. 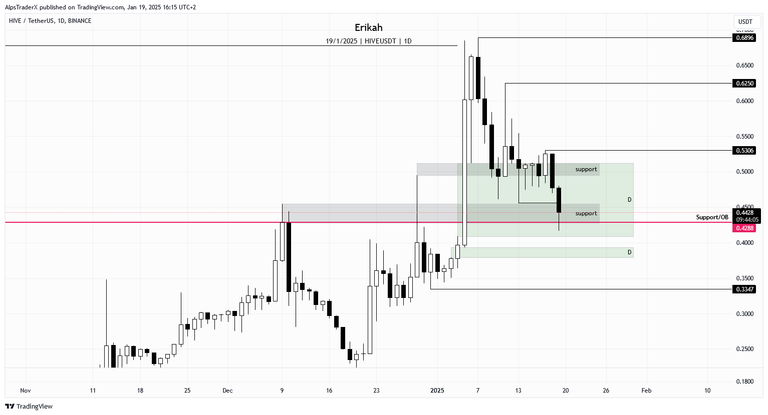
The daily chart shows clearly where price is at the time of writing.
This is what I wrote last week:
If price closes below $0.5119 and loses the grey box, which is support, there's a chance to sweep liquidity below $0.4614. There's another level of support between $0.4284 (which is the top of the daily OB as well) and $0.455, which must hold price.
To simplify all that, I don't mind price wicking down to $0.4098, that would be a healthy move to rebalance the gap and better now than later, but it has to bounce there and close above $0.5119 for bullish continuation. source
Well, today, the situation is like this. The first support did an excellent job supporting price for 12 days, then yesterday couldn't hold price anymore and closed below. Today price broke down to the lower support area I mentioned and actually wicked down close to the bottom of the gap (marked with green on my chart) and rebalanced the gap almost completely. For those not familiar with what this means, it means price swept internal liquidity.
The day is not over yet, there are almost 10 hours till the candle close, so we don't know how this candle will look after close, but here's what you can expect. At the time of writing, price is above the support line and above the order block (OB) as well. As long as it stays above these two lines that actually overlap, we can expect bullish continuation. Should price lose this level, the next one I'm looking at is the slim gap below the one price is inside right mow, which means price between $0.3938 and $0.3793. In case that gap can't defend price, the next liquidity level is at $0.3439 and ultimately $0.3347.
This is from my post last week:
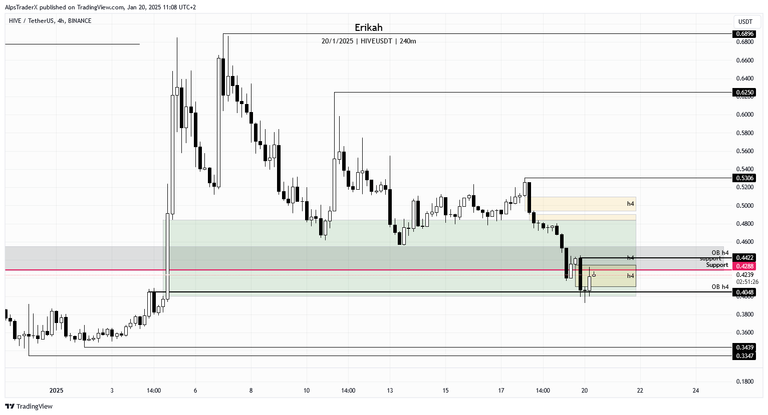
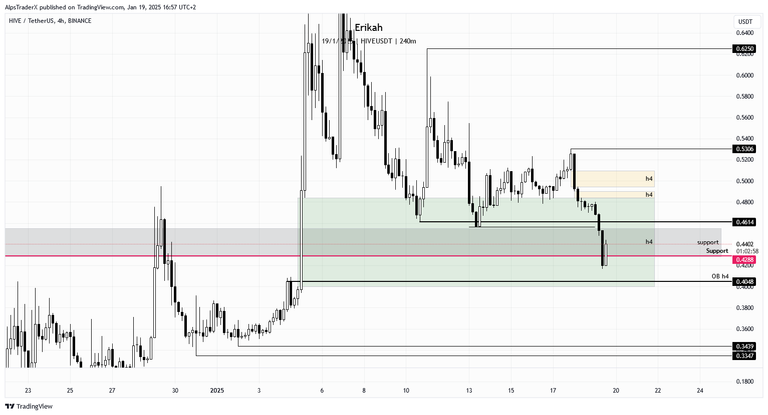
there's a possibility for price to close below the gap and go for the low at $0.4614, which is in confluence with the h4 OB. Nothing to be concerned about, it can still bounce there and have bullish continuation. If that level is lost, there's a possibility for price to go as low as $0.4048. Time will tell. source
Since then the $0.4614 low was swept and price dipped lower. At the time of writing, price is still inside the bullish gap, which is almost completely rebalanced and has not engaged with the h4 OB ($0.4048) yet.
In an ideal world, I'd like to see price close above the gap, in which case the next liquidity pool would be the two bearish gap marked with yellow and then $0.5306. If prices closes below the green gap, all I can see is low resistance liquidity, will $0.3439.
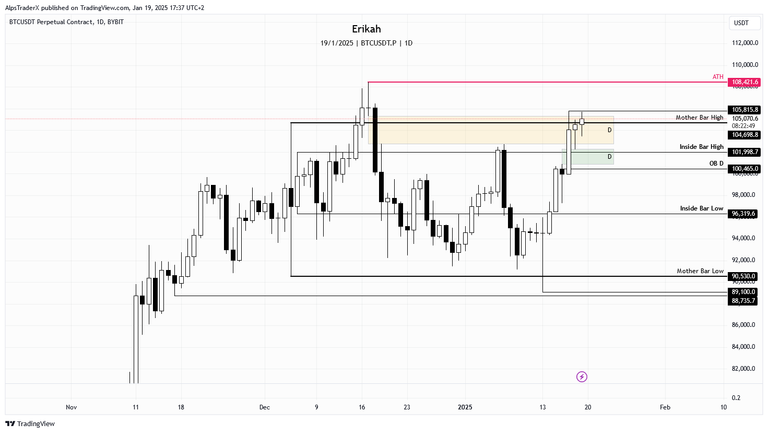
$BTC had an impressive evolution to the upside since my last report. This week $BTC went from $89,100 to $105,000. At the time of writing, on the daily chart, price is slightly above the mother bar high, ready to sweep the $105,815 high. It is still inside the bearish gap and for bullish continuation it has to close above it. In case the bearish gap marked with yellow fails to hold price, there's a chance for price to revisit the bullish gap below. or engage with the daily OB at $100,465.
What can we expect next week?
Next week is going to be ... well, imagine it as a roller coaster ride.
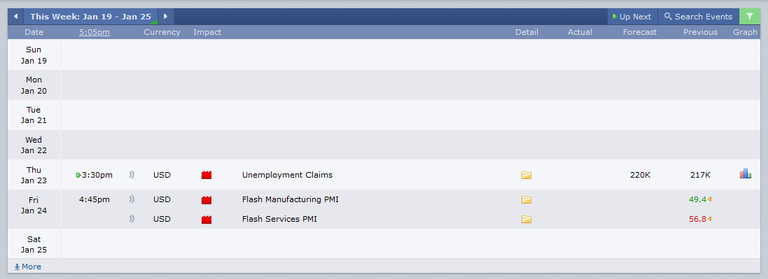
As far as news is concerned, we only have two red folder days and we don't even have the forecast for Flash manufacturing and flash services for Friday yet. However, things are not as simple.
Monday traditional markets are closed because we have Donald Trump's inauguration ceremony. This is a huge event and with great significance, if you know how to read market sentiment. The event itself is bullish, because we finally have a pro crypto US president, who has been promising a lot. (Will he keep his promises is a different topic for another day.)
Long story short, everyone is expecting the markets to sky rocket, but there's a huge chance the event is already priced in as many assets have already pre pumped and we may witness the sell the news part, which is plain English means dumping. There's a chance we'll see $BTC back to around $100k.
How this is going to affect $HIVE? Honestly? I have no idea. $HIVE is a different animal as I've said it so many times before, so I can only reply on what the chart tells me. All I can say is, stay safe, don't gamble with your hard earned money.
As always, this is a game of probabilities, not certainties. Also please note, this is not financial advice, it's my view and understanding of the market.
All charts posted here are screenshots from Tradinview.

If you're a newbie, you may want to check out these guides:
- Communities Explained - Newbie Guide
- Cross Posting And Reposting Explained, Using PeakD
- Hive Is Not For Me
- How To Pump Your Reputation Fast - Newbie Guide
- Tips And Tricks & Useful Hive Tools For Newbies
- More Useful Tools On Hive - Newbie Guide
- Community List And Why It Is Important To Post In The Right Community
- Witnesses And Proposals Explained - Newbie Guide
- To Stake, Or Not To Stake - Newbie Guide
- Tags And Tagging - Newbie Guide
- Newbie Expectations And Reality
- About Dust Vote And Hive Reward Pool, by libertycrypto27


