It's Sunday again and time for another technical analysis. The funny thing is, I like these TA posts and can't wait for Sunday to be able to analyze $HIVE. Not because I'm concerned about the price, but because it's a fun game. Anyway, let's get started, shall we?
My last post was on Monday, right after NIKKEI dropped sharply, dragging with it the whole market, or every market if you like. NIKKEI is doing fine, trying to stay above the high time frame trend line. Now let's see what $HIVE has been doing.
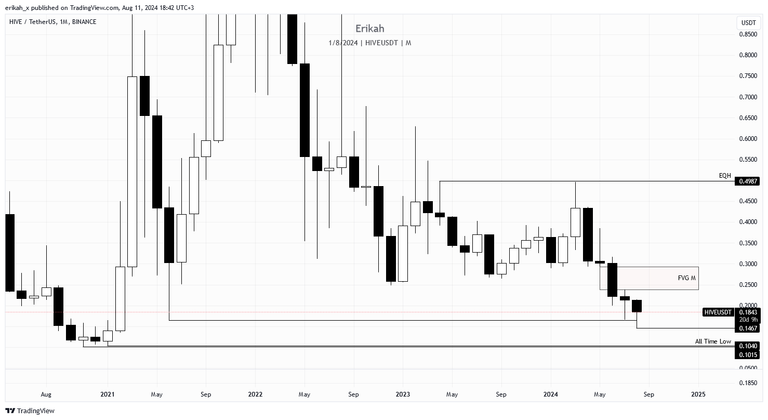
We're not nearing the end of the month, but it's always good to have a look at the monthly chart. It's been 12 days since the month open and so far price printed another bearish candle with a long downside wick. Price swept external liquidity below the two candles on the left, which represent June 2021 and July 2024. There's a long way till the month close, so anything can happen, but for bullish continuation price needs to close above the bearish FVG, marked with red and then seek liquidity higher, where those nice equal highs are. Otherwise we could see the sweep of the ATL (all time low) and witness the printing of a new all time low.
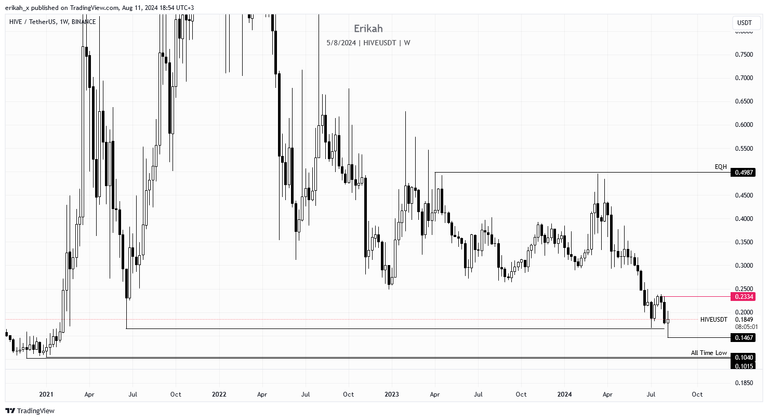
The weekly chart looks a little bit better, but nothing to write home about. The current candle, although it's not closed yet and has a very small body (which indicates indecision), it it bullish. For bullish continuation, price has to close above the pink line, at $0.2334. Otherwise we could see sweep of the local low, at $0.1467, or even worse.
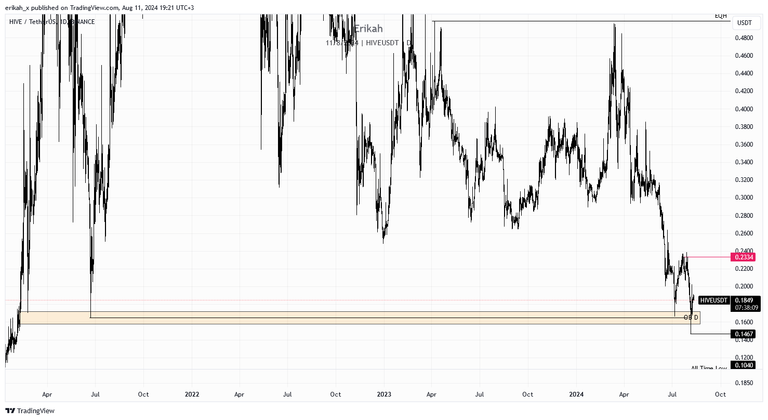
I kept the order block (OB) on the daily chart from last week, to be able to see what's happened since then.
Zooming in, we can get a more clear picture. Price swept a relatively recent low, and a very old low on Monday, but still managed to close above the old bullish OB, which is meant to hold price. We had some interesting price action on Wednesday, the daily candle closed bearish, but with a huge upside which, which indicates a big buying order I think. We have these from time to time, most likely someone put in a big buy order, which caused the sweep of the highs, but as there was not enough buying pressure to keep price at that level, the candle closed bearish.
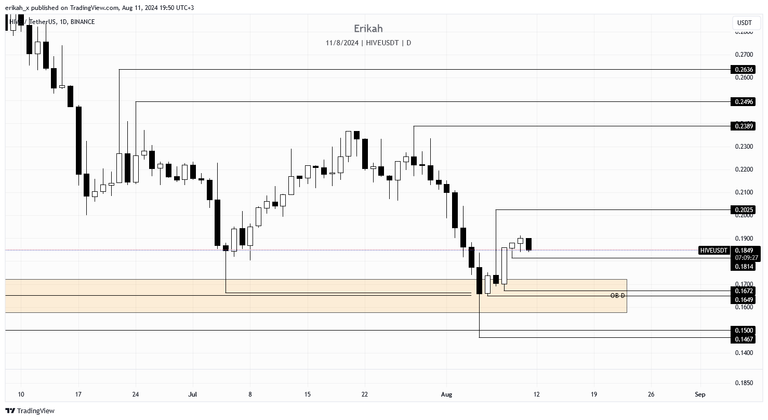
We had three consecutive bullish candles, which were much needed, but today's candle is bearish so far and should it close like it is, it will be a bearish engulfing candle. The interesting thing is, there are no gaps on the sell side of the curve, or on the buy side, so the existing liquidity pools are the wicks below or above each candle.
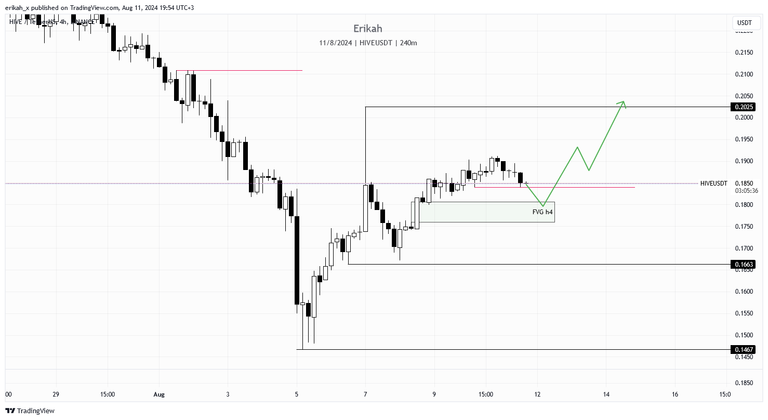
On a more granular scale, the h4 chart indicates some consolidation for now. It's the weekend, when usually volatility and liquidity are both low, so it's normal. We have equal lows very close to the current candle, marked with pink, which usually work as a magnet. I'm expecting the bullish FVG (marked with green) to hold price and then see continuation to the upside. If the bullish FVG can't hold price, then we can see the sweep of $0.1663, or lower.
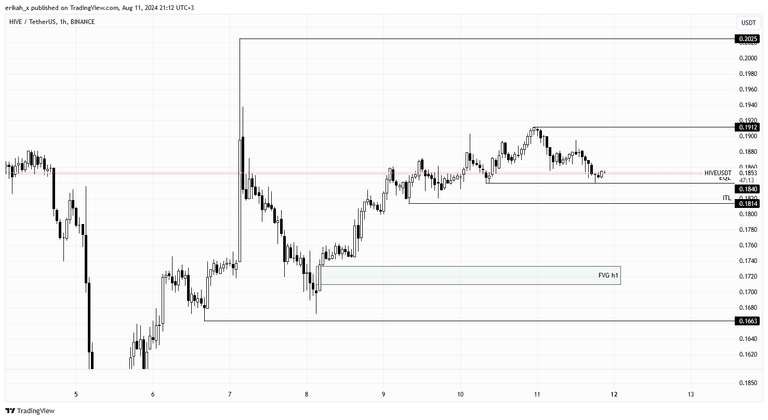
I don't like to chart $HIVE on low time frames as even the h1 chart looks like a lot of noise, it's a pure headache. However, I see some equal lows at $0.184, a level which most likely is going to be swept soon. The downside looks very balanced as price took the time to get where it is now, so the buy side of the curve is basically low resistance liquidity, till the green box, the h1 FVG. The upside is kind of the same, till $0.1912, after which, the next liquidity pool is at the top of the wick at $0.2025.
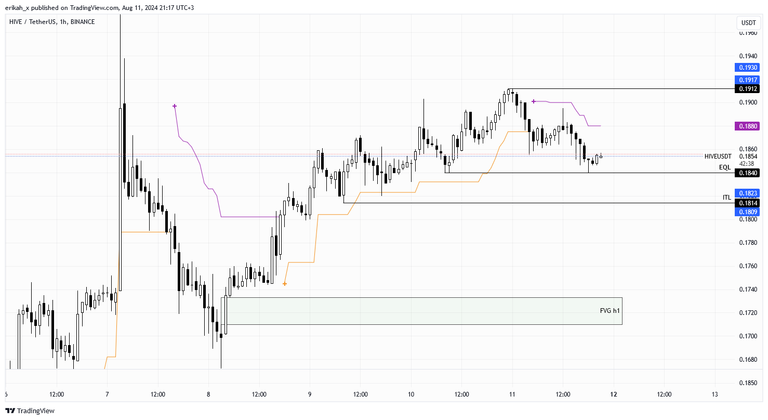
Using my BPro indicator on the h1 chart, you can see, price is trying to get above the trend line, at $0.188, marked with purple, where bullish trend can be confirmed.
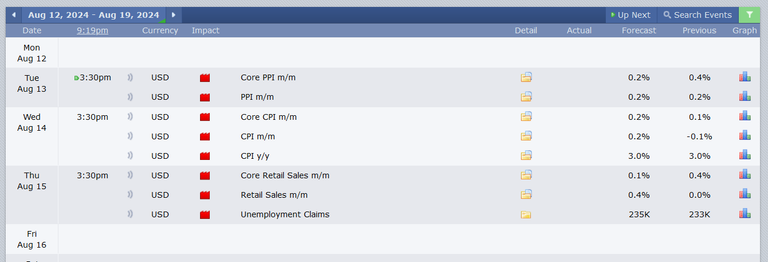
As I've been saying, this is a game f probability, not certainty and anything can happen. Next week is going to be very interesting as we have three red folder news days and the data expected is important. $HIVE is a very small fish in this big sea, but it's paired with the US dollar and it is affected one way or the other. Volatility is to be expected and manipulation too I believe.
Taking into consideration the current state of the market, $HIVE is not in a bad position at the moment. I know everyone would want $HIVE to moon and blow off every roof, but that's a process that takes time. Now is the time to accumulate for what is to come and not cry about the current state of the price.
Let's see what the upcoming week brings us. If the news is bullish, we're going to see some upward movement for sure.
As always, this is a game of probabilities, not certainties. Also please note, this is not financial advice, it's my view and understanding of the market.
All charts posted here are screenshots from Tradinview.

If you're a newbie, you may want to check out these guides:
- Communities Explained - Newbie Guide
- Cross Posting And Reposting Explained, Using PeakD
- Hive Is Not For Me
- How To Pump Your Reputation Fast - Newbie Guide
- Tips And Tricks & Useful Hive Tools For Newbies
- More Useful Tools On Hive - Newbie Guide
- Community List And Why It Is Important To Post In The Right Community
- Witnesses And Proposals Explained - Newbie Guide
- To Stake, Or Not To Stake - Newbie Guide
- Tags And Tagging - Newbie Guide
- Newbie Expectations And Reality
- About Dust Vote And Hive Reward Pool, by libertycrypto27
