Looking back, I can't believe it's been already a month since I started doing these weekly $HIVE analysis. This is the fourth and I hope not the last one. The funny thing is, I've never been really interested in the price of the token, because this is a long term project, the plan is to take profit close to the peak in the next bull run, not just to make a quick buck, but since I'm writing these reports, I'm checking the chart quite often, but purely from technical point of view. Anyway, let's see how things stand, what's happened in the meantime.
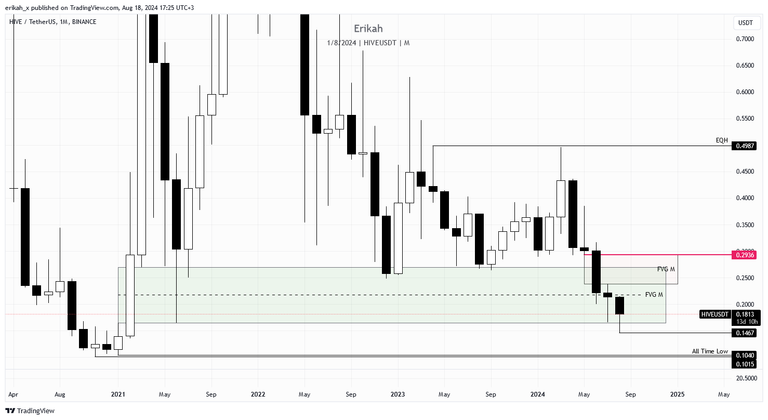
On the monthly chart, things are still not looking promising. There are still 13 days to go till the candle close, plus what's left of today, but the candle we're seeing right now is a bearish one, with a significant body. Right now price is still inside the bullish Fair Value Gap (FVG), so till it closes above it and inverts it, my bias on the monthly is bullish. The problem is, it is below the mid-line, closer to the bottom of the FVG and even if price closes above the bullish FVG, it finds itself inside a bearish one, marked with red. So for bullish continuation on the monthly, price needs to close above and retest successfully the $0.2936 level.
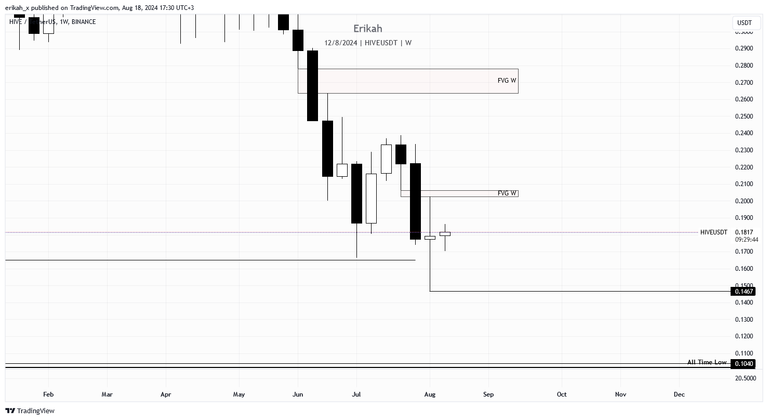
On a weekly scale, things look a bit better. Last week we got a doji candle, with quite long upside and downside wicks, which indicates indecision in the market. This week's candle, although it's not closed yet, looks like a doji as well, but if nothing major happens till midnight (it's Sunday, so no major volatility or volume is expected, but who knows), chances are the candle can close above the previous one. This is obviously not something to write home about, but at least it's a little bullish sign. Price moves from external liquidity, to internal and so on, so external liquidity was swept this week as price swept two old lows, so now expectation is for price to seek internal liquidity, which means rebalance and hopefully invert the bearish FVG, marked with red. If price get rejected there, he next liquidity pool is the current low at $0.1467.
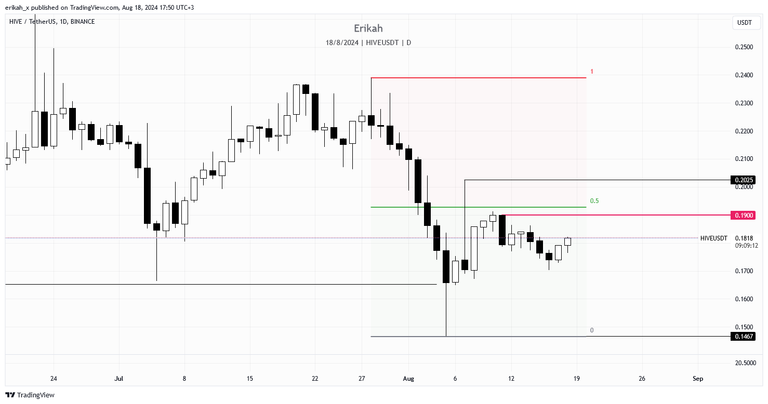
Looking at the daily, things are a bit different. Based on the dealing range, price is in discount territory, we usually long from here. There are no gaps on the sell side, to reject price and we have a higher low as well, which is a good sign. If price closes above $0.19, I can see bullish continuation.
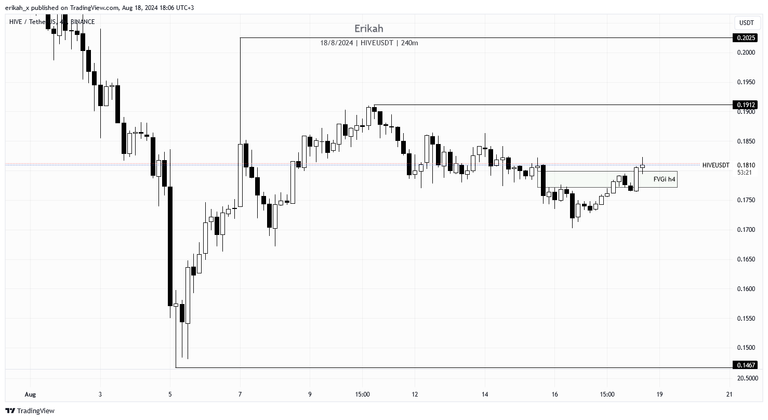
The h4 chart looks a bit better. The last candle closed above the FVG, inverting it and the current candle, that closes in an hour, looks bullish so far. Should this candle close bullish, that means confirmation. The upside looks like low resistance liquidity run as there's no gap to stop price. If price manages to sweep $0.1912 and manages to hold it, that level is in confluence with the daily order block I marked with red in the previous chart and would indicate continuation.
What I don't like here is that crazy long upside wick at $0.2025. Unfortunately $HIVE is not a very liquid asset and a bigger order can do this. We've seen this in the past, and as history has the habit of repeating itself, we're going to see these crazy wicks in the future too.
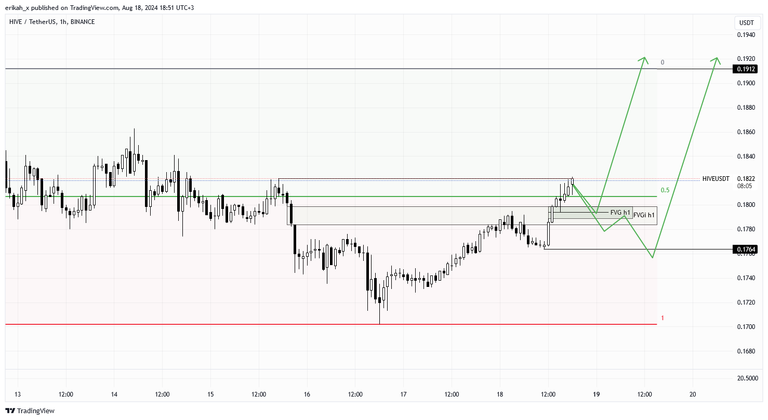
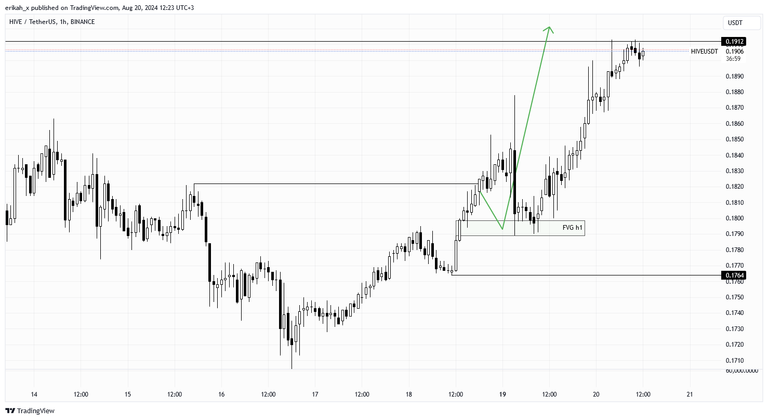
The h1 chart looks good in my eye, I quite like it.
We had a bearish FVG at the level of $0.18, which rejected price earlier today, forcing it into creating a higher low. Price had a second attempt, which was successful. We can see the momentum that led to price closing above the FVG, inverting it and turning it into a bullish one (FVGi). On the leg up, we have a bullish FVG, which was retested and held price nicely.
I'm expecting price to hold this level and continue to the upside. Should price reject here, there's a chance the FVG and the FVGi gets retested again. In case price closes below it, there's another bullish FVG below, which is not marked on the chart, but regardless, it should defend price. If not, I'm looking at the $0.1764 level to be swept.
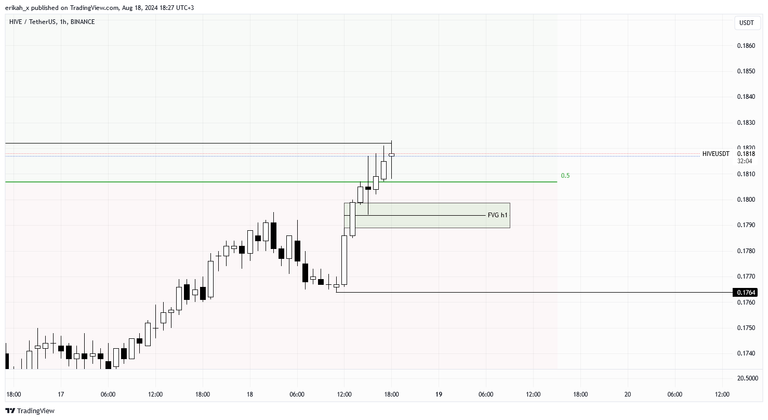
I don't know how many of you have a general knowledge of candlestick charts and fair value gaps, but this one is a beauty. They say in case of a good FVG price should not go below or above the mid-line. Look at how nicely price bounced off the mid-line.
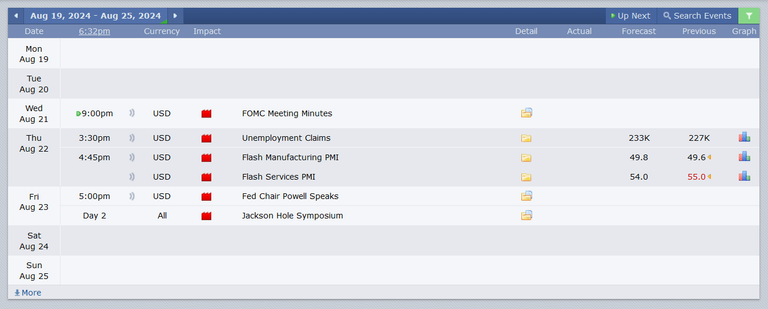
In terms of volatility, next week we're going to have three red folder news days, which means volatility, to $HIVE too, as our token is paired with the US Dollar. FOMC and unemployment claims are important, so who I'm expecting volatility on these days.
As always, this is a game of probabilities, not certainties. Also please note, this is not financial advice, it's my view and understanding of the market.
All charts posted here are screenshots from Tradinview.

If you're a newbie, you may want to check out these guides:
- Communities Explained - Newbie Guide
- Cross Posting And Reposting Explained, Using PeakD
- Hive Is Not For Me
- How To Pump Your Reputation Fast - Newbie Guide
- Tips And Tricks & Useful Hive Tools For Newbies
- More Useful Tools On Hive - Newbie Guide
- Community List And Why It Is Important To Post In The Right Community
- Witnesses And Proposals Explained - Newbie Guide
- To Stake, Or Not To Stake - Newbie Guide
- Tags And Tagging - Newbie Guide
- Newbie Expectations And Reality
- About Dust Vote And Hive Reward Pool, by libertycrypto27