One of the trending information crypto investors will tell you about is the sudden bull price of binance token (BNB).
This article will analyze the performance of BNB throughout the month of October, 2022 using SPSS software.
Chart showing the price of BNB
Box plot of BNB
Maximum and minimum price of BNB
Conclusion
Other images
Chart showing the price of BNB
The price of BNB can be seen in the chart below. On the 28-30th of October, BNB made an attempt to rise above $300.
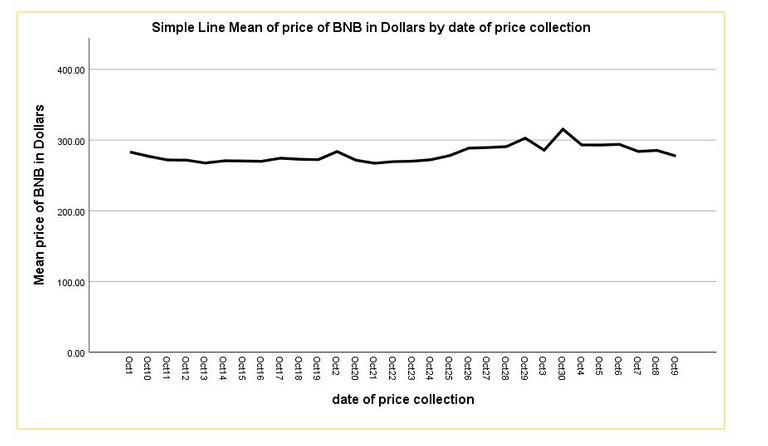
It is a good time for crypto investors to take out some profit especially if you purchase higher dollar worth of it.
I predict if BNB goes this way before the middle of the year in 2023, it might approach $500 as it head its way to a thousand dollar per BNB before the end of 2023.
The bar chart graph can be seen alongside.
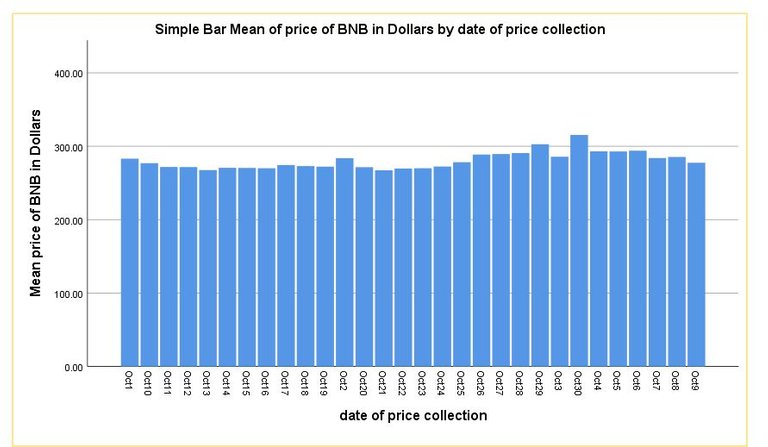
Box plot of BNB
Boxplot is used to indicate the price range of a crypto asset over a period of time. It can be seen in the diagram below that the numbers 88, 87, 87 are the entry price of BNB as arranged in the spreadsheet in SPSS.
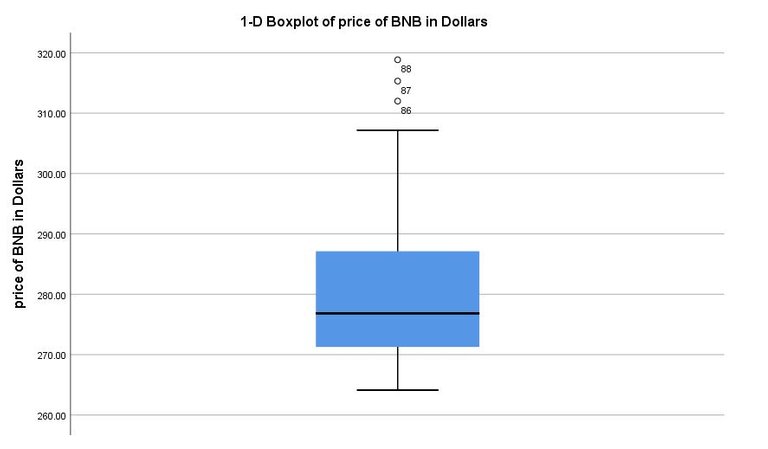
Details of this can be seen in the data view image after the conclusion. It shows that there is an unusual spike in the price of BNB.
Maximum and minimum price of BNB
The maximum and minimum price of BNB for the period of October can be seen in the table below.

However the mean price for the duration is $280.80. When the mean price reaches $300 indicates that the price must have been above $300.
Conclusion
The performance of BNB price for the month of October has been presented in this article. It is a good time to take out some good profit for crypto investors.
Other images includes
Data view of BNB price
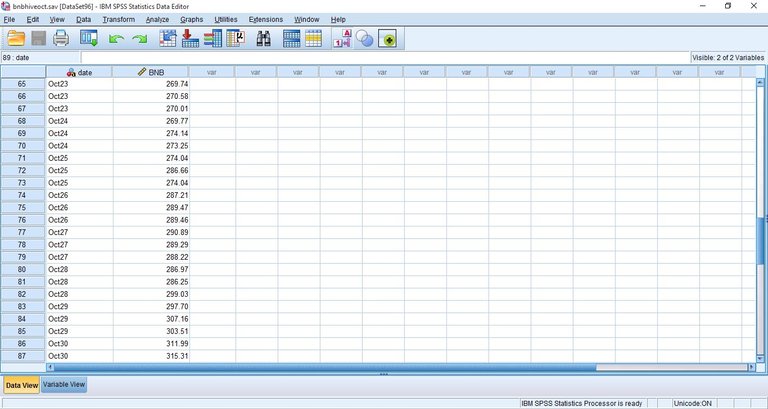
Variable view of BNB price

Posted Using LeoFinance Beta