This article presents the relationship of BITCOIN and BNB price in the past 47 days starting from October 1- November 7, 2022. It also contains a descriptive summary of both assets.
In the course of this article, I shall consider the following;
Result of Correlation analysis of BNB and BITCOIN price
Line graph of BNB and BITCOIN.
Maximum and Minimum price of BNB and BITCOIN
Conclusion
Result of Correlation analysis of BNB and BITCOIN price
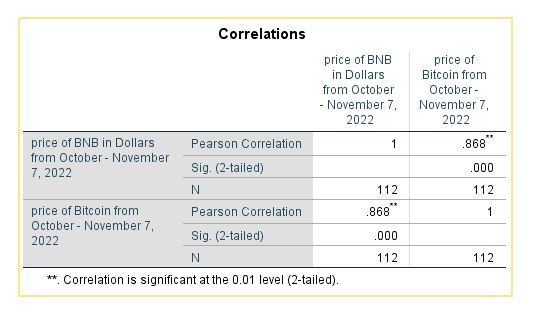
The result of correlation analysis shows that with a coefficient of 0.868.
there is a positive and strong relationship, meaning that the price of BITCOIN can influence that of BNB at a higher rate. We shall prove this in the line graph section.
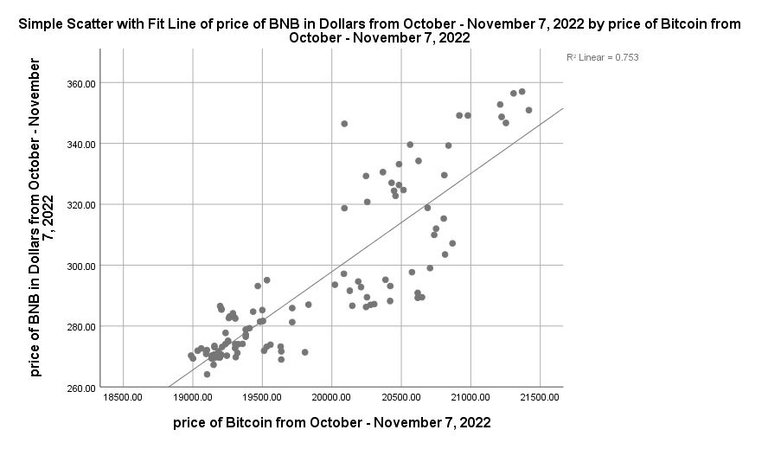
More detailed view of correlation analysis between BNB and BITCOIN is presented in the scatter dot diagram below.
From the diagram, it can be seen from the diagonal line that wherever the price of BITCOIN falls, the price of BNB can be gotten. This makes it useful in relationship prove and prediction.
Line graph of BNB and BITCOIN.
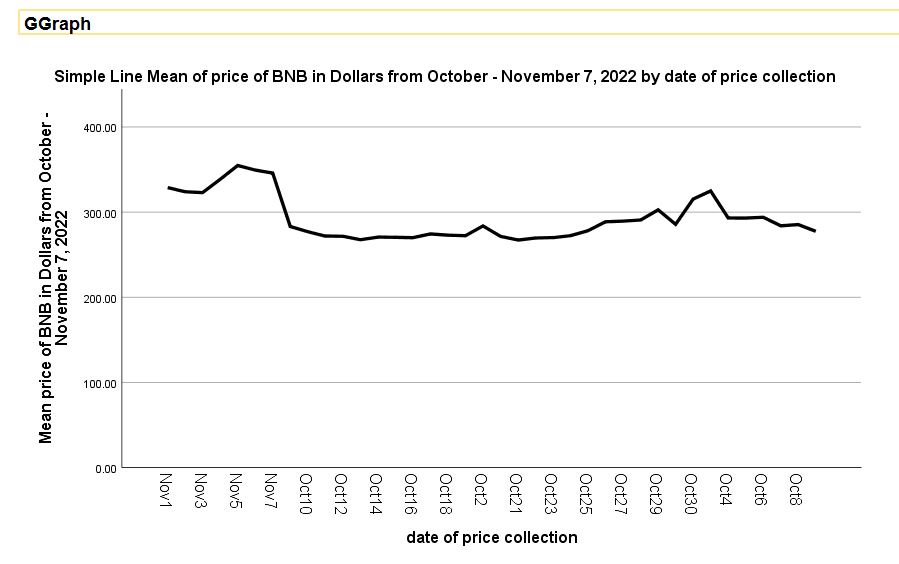
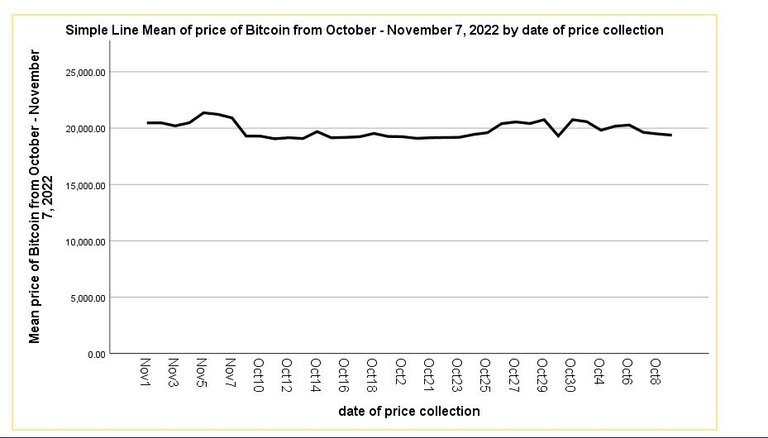
The line graph shows the date and price of both crypto assets presented in a line. It is similar to the bar chart.
BNB
BITCOIN
It is visible that there is a pump in the price of both crypto assets during the early period of November which shows a good relationship.
Maximum and Minimum price of BNB and BITCOIN
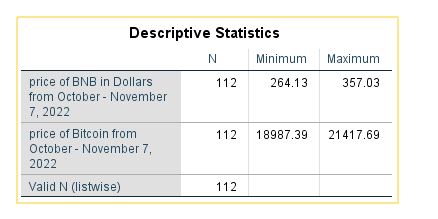
The maximum and minimum price of both crypto assets from October1 – November 7, 2022 is presented in the table below.
Conclusion
This article has presented the analysis of relationship between BNB and BITCOIN with other descriptive diagram showing their prices.
