There has been a bull run for DOGE coin in the month of October, This article presents a descriptive report of DOGE coin analysis using SPSS software.
The following are sub sections considered in this report.
Box Plot of DOGE coin
Maximum and Minimum Price of DOGE
Bar chart for DOGE Price
Conclusion
Other Images Includes
Box Plot of DOGE coin
The box plot of DOGE price shows the normal price of DOGE before the spike in a box with whiskers.
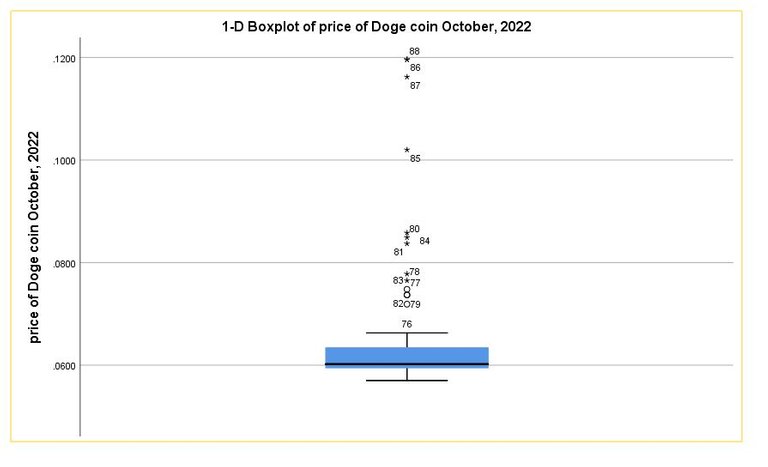
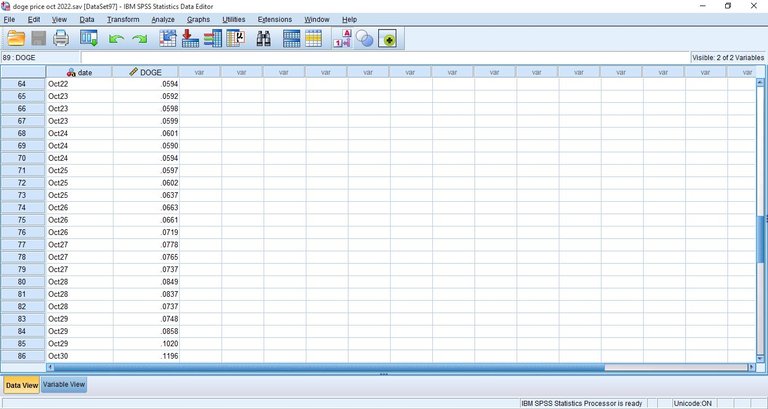
During the month of October the normal price for DOGE ranges within the box but there is a sudden observance of a bull price which are presented as numbers. The number represent rows in SPSS spreadsheet showing their highest price. Details of this can be seen in the data view section.
Maximum and Minimum Price of DOGE
The maximum and minimum price of DOGE coin is seen in the table below. The mean price of DOGE coin in the month of October, 2022 is $0.0649.

Bar chart for DOGE Price
The bar chart below shows the price of DOGE represented in bar diagram in the month of October, 2022.
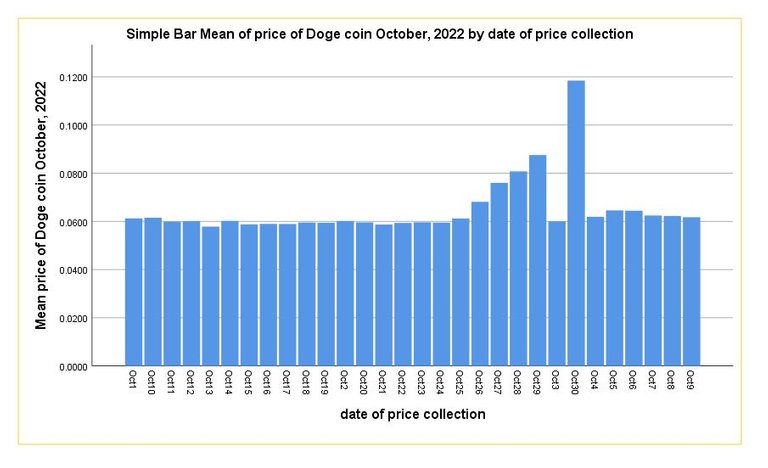
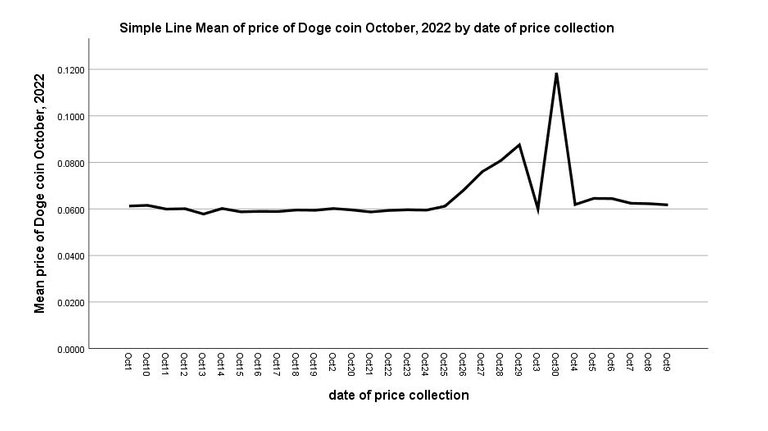
It can be visualized that there is a step-wise bull increase in the price of DOGE from October (25 – 30)th, 2022. If it continues this way before the end of doge may rise up to 5 cent per coin.
Conclusion
This article presents a descriptive report of DOGE coin performance in price in the month of October, 2022. It present the information in box plot, maximum and minimum values and bar charts.
Other Images Includes
Data view mode
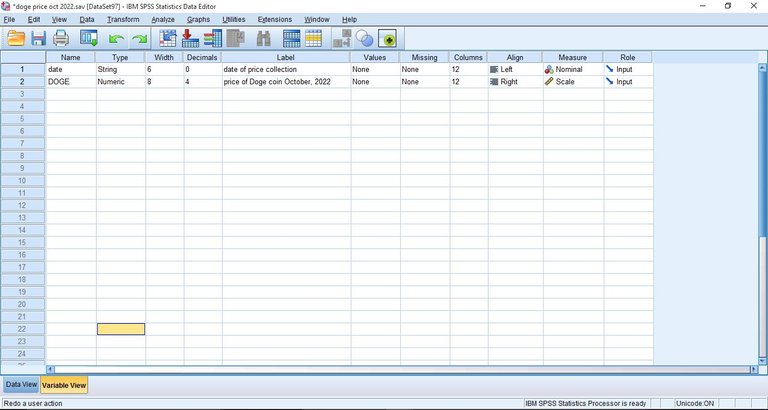
Variable view mode
Thanks for reading
Posted Using LeoFinance Beta


