Relationship Between HIVE and POLYCUB. In our case study the relationship between HIVE and POLYCUB is presented under the following subheading.
Result of analysis between HIVE and POLYCUB

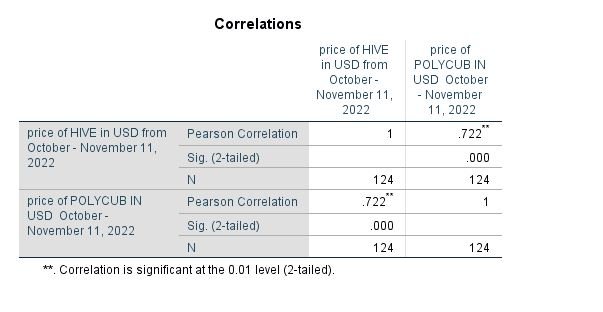
The summary of analysis of relationship can be seen in the diagram shows that the coefficient of relationship is 0.722. This indicates a very strong positive relationship meaning as the price of HIVE pumps, that of POLYCUB will pump.
Line graph of HIVE and POLYCUB
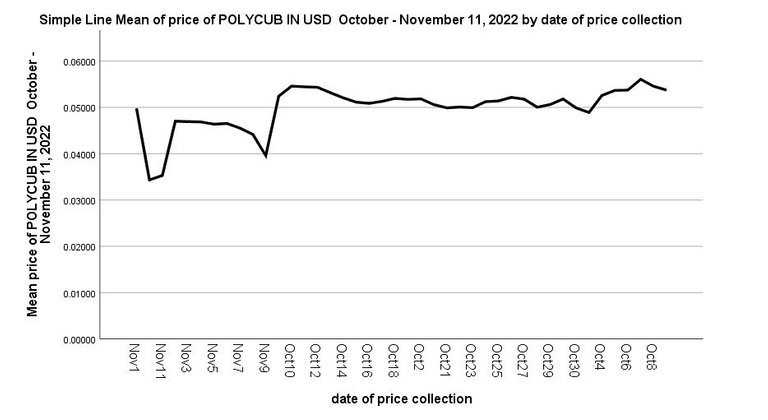
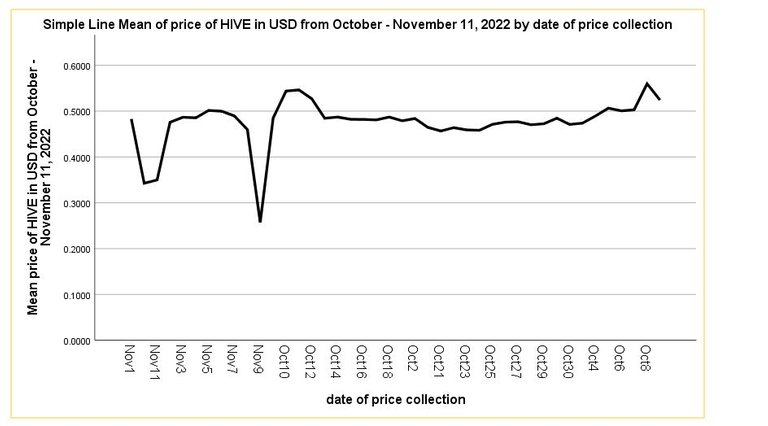
Line graph shows the performance of both crypto asset within the month of October to November 11, 2022.
For POLYCUB

HIVE

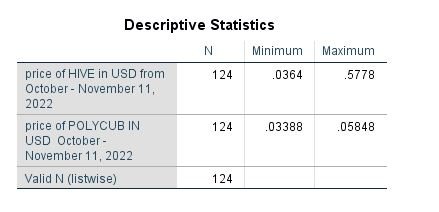
Maximum and minimum price of HIVE and POLYCUB
The maximum and minimum price of HIVE and POLYCUB for the period of October 1 – Nov 11, 2022.

Conclusion
This article was aimed at determining the relationship between the price of HIVE and POLYCUB which can be proven in the correlation table and in the Line graph below.
Thanks for reading.
Posted Using LeoFinance Beta