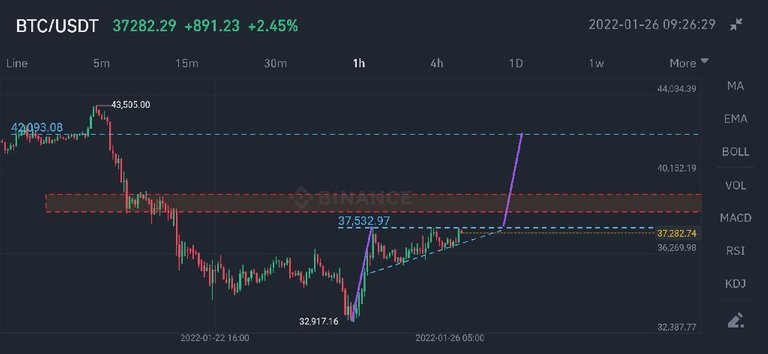
BTC is pointing a Bull Flag on 1H time frame. Pattern is also visible on a higher timeframe of 4H. Daily looks bullish with already breaking out a Three Inside Up Pattern and 3 green candles in a row. But we have a strong regection zone (39-40k). Bull Flag is pointing a target of 42000 which is also a local resistance level. RSI on 1H chart doesn't seem much bullish and is slightly downwards which is showing a little bearish divergence. This means pattern is not too strong and can get a fake out as well to trap longs. Volume is pretty good, and a 4H candle close above 37500 level can indicate a upward breakout. Do use Stoploss if you enter in a trade because we have a resistance level just above the breakout and we can get rejected.

Will this play out? or pattern will break towards downside putting us back to 35k or potentially bottom of flag? Please share your suggestions in coments.
NFA, DYOR.
Posted using LeoFinance Mobile

