
Introducing the Summoner Lab platform
One of the tournaments I participated last week was the Summoner Lab Launch Party. The Summoner Lab is a platform developed by @muwave that uses Splinterlands' API to pull card market data and display them in charts that allows for customisation through a vast array of technical indicators. Because I ended the tournament in the 13th place, I earned a one-week period for trial of the platform (which @muwave was kind enough to extend, as I could not try it last week - thank you!). Today I'll therefore discuss some insights that come from the analysis of selected cards, coupled with reflections on fundamental events that will affect the economics of Splinterlands.
Spoiler: in my opinion, Summoner Lab is an amazing tool! It is not only functional but beautifully designed. I really welcome this development. The tool can aid many in their investment decisions. But before looking into some of the insights derived from the Summoner Lab, I make a reflection on the appropriateness of technical analysis of Splinterlands' cards (second spoiler: it is possible, but take its results with care). This is what I discuss next.
Is the technical analysis of Splinterlands' cards possible and meaningful?
The so-called "technical" analysis of financial assets - be them stocks, treasuries or crypto currencies - is controversial. Purists (probably economists) say that future performance has nothing to do with historical price movements, because what maters are the assets' underlying fundamentals and material developments that affect these. If technical analysis could predict future price movements based on past fluctuations - the criticism continues - then every trader would beat the market benchmark. An asset's price would therefore be affected by material facts and only material facts (but not to non-material facts). This is the efficient market hypothesis (EMH), associated with Nobel Prize Winner Eugene Fama, in a nutshell.
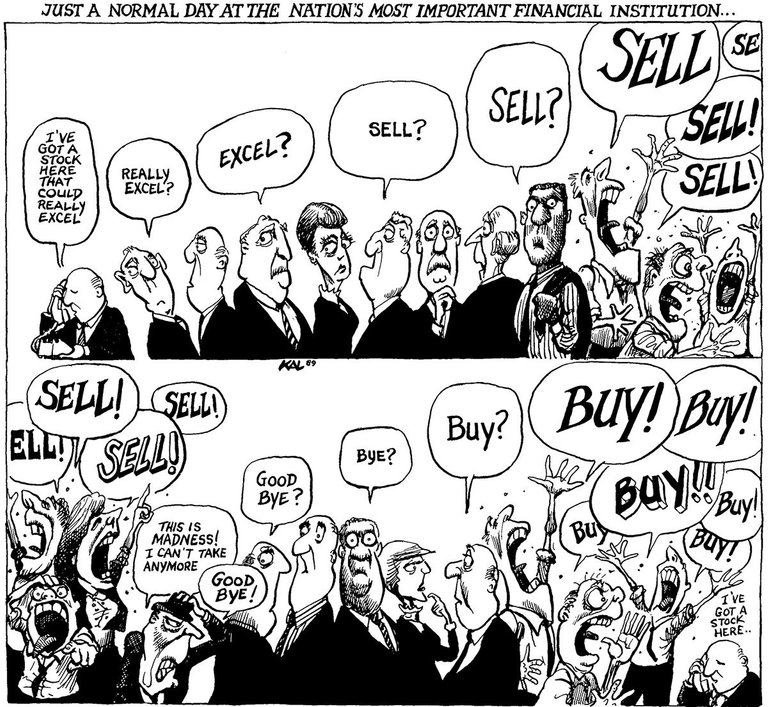
Kal's cartoon shows what irrational herd behaviour is
As I argued elsewhere, yes, "as time goes by, the fundamental things apply", but markets and their agents are all but rational, and herd behaviour may well result in self-fulfilling prophecies: if a large enough number of agents see a bullish technical pattern and buy the asset at the same time, then the asset's price will go up. I am an economist and I understand the reasoning behind the efficient market hypothesis. Indeed, in my BA essay I tested the EMH for pure stock splits - a non-material event - in the Brazilian stock exchange, finding that there was a winning strategy in buying the asset on the stock split announcement and selling it three days after the ex-date (when the split actually happened). Stock splits also led to a statistically significant growth of the liquidity of the shares - so much so that many increased their weight in the Brazilian blue chip index Ibovespa ($ibov). According to the EMH, neither a winning strategy, nor an increase in liquidity should be associated with a non-material event like a stock split. While the EMH is a powerful analytical tool, real market are all but perfect or efficient.
And it is due to market imperfections that I believe that technical indicators of momentum and trend do offer important information of market developments. But such type of analysis only makes sense, only holds power, if the asset is liquid ("a large enough number of agents"). Liquidity is the "ease with which an asset or security can be converted into ready cash without affecting its market price". When the market for an asset is illiquid, then a single trade may determine the current market price, which may or may not be close to its real "equilibrium" price (whereby supply meets the demand). The information contained in the current market price - about how many sellers and buyers are willing to pay that price - therefore diminish with the decrease in liquidity.
This brings me to the question of whether it makes sense to analyse Splinterlands' assets - or more precisely, cards - through technical analysis. With Summoner Lab, it is now possible to do these analyses of Splinterlands' cards. But are they liquid enough for the analysis to be meaningful? The answer is yes and no. That's because there are many possible indicators of liquidity, and it also depends on the period of reference. Two basic indicators of liquidity are the physical and financial volumes an asset negotiates over a given period. I would say that many Splinterlands' cards are liquid on a daily basis: if you want to buy or sell it for a price close to the current ask or bid price, you are very likely to have your order executed in lass then 24 hours, which is particularly true the lower the cards' rarity is (all other things equal, common and rare cards are more liquid than epic and legendary), the more recent is its edition (modern editions - Chaos Legion and its reward cards, Untamed and Dice - are more liquid than wild editions - Alpha, Beta and old promo and rewards), and depending on the foil (regular is more liquid than gold).
A less used but very relevant liquidity indicator is the bid-ask spread: the difference between the lowest ask price and the highest bid price. According to this metric, the liquidity of Splinterlands cards is much lower. The Summoner Lab does not currently offer this information, because bidding is not a standard feature of the Splinterlands' card market: it is a tool offered by the peakmonsters.com front end platform (I am not aware of other front ends that allow for bidding on Splinterlands' cards). The liquidity difference between a regular foil common card and a gold foil legendary card becomes visible when we look at the bid-ask spread: a common Pelacor Deceiver is currently being offered (ask price) for $0.017, and being bought (bid price) for $0.016: the $0.001 difference is just 6.25% of the current market value ($0.016). A gold foil Djinn Oshannus has a bid-ask spread of $4.91 or 7.5% of its market value. Both have similar relative bid-ask spreads, which are not particularly high. But consider the bid-ask spread of the most expensive Splinterlands' card by market value: Prince Julian, valued at $14,286. The bid-ask spread is a whopping $49,679 or 348% of its market value! These rarest cards are very illiquid: no wonder we don't see one being negotiated every day. And the information contained in its market prices (bid, ask or market value) is very little.
So: is the technical analysis of Splinterlands' cards possible? For those low-liquidity cards, technical analysis does not hold - indeed, the Summoner Lab indicates there is "no data" to produce charts for certain cards - like Prince Julian (both regular and gold foil). But for the more liquid cards, the answer is yes with a pinch of salt: some cards are liquid, but currently negotiated for their in-game utility more than for their financial value. There are some people (and their bots) that flip-trade cards, but most of the liquidity comes from people who want a useful card or needs collection power (CP). The swings in prices depend more on the supply (cards printed and in circulation), which in turn is what determines its rarity, and on the demand for the card based on utility. That said, I do think we can see some interesting technical patters emerging when we look at the charts on Summoner Lab. let's look at these.
Analysing the price chart of selected cards
For this analysis, I decided to look at the charts of five very useful cards - indeed, some of the most used in the recent seasons, according to the analysis by @jacekw:
- Mylor Crowling, the most used summoner in Bronze league (and third in Champions);
- Kelya Frendul, the most used summoner in Silver, Gold and Diamond;
- Furious Chicken, the most used card in all leagues (see comment in @jacekw's post for the list by league);
- Creeping Ooze, top three most used card in Bronze, Silver and Gold; and
- Djinn Oshannus, the most used legendary card in Bronze and Silver
My set up here is much simpler than in my analysis of bitcoin prices, for which I use many moving averages, stochastic indicator, and Fibonacci retracements. For Splinterlands' cards, I used candlestick prices (even though I don't think candlestick is quite useful here), volume, relative strength index (RSI) and relative volatility index (RVI) (all with my calibrations). What I'm looking is not whether those indexes reached an upper or lower threshold or surpassed a mid-level: I am looking for trend divergences - whether one indicator is moving upward while other(s) move downward (or vice-versa).
Mylor Crowling
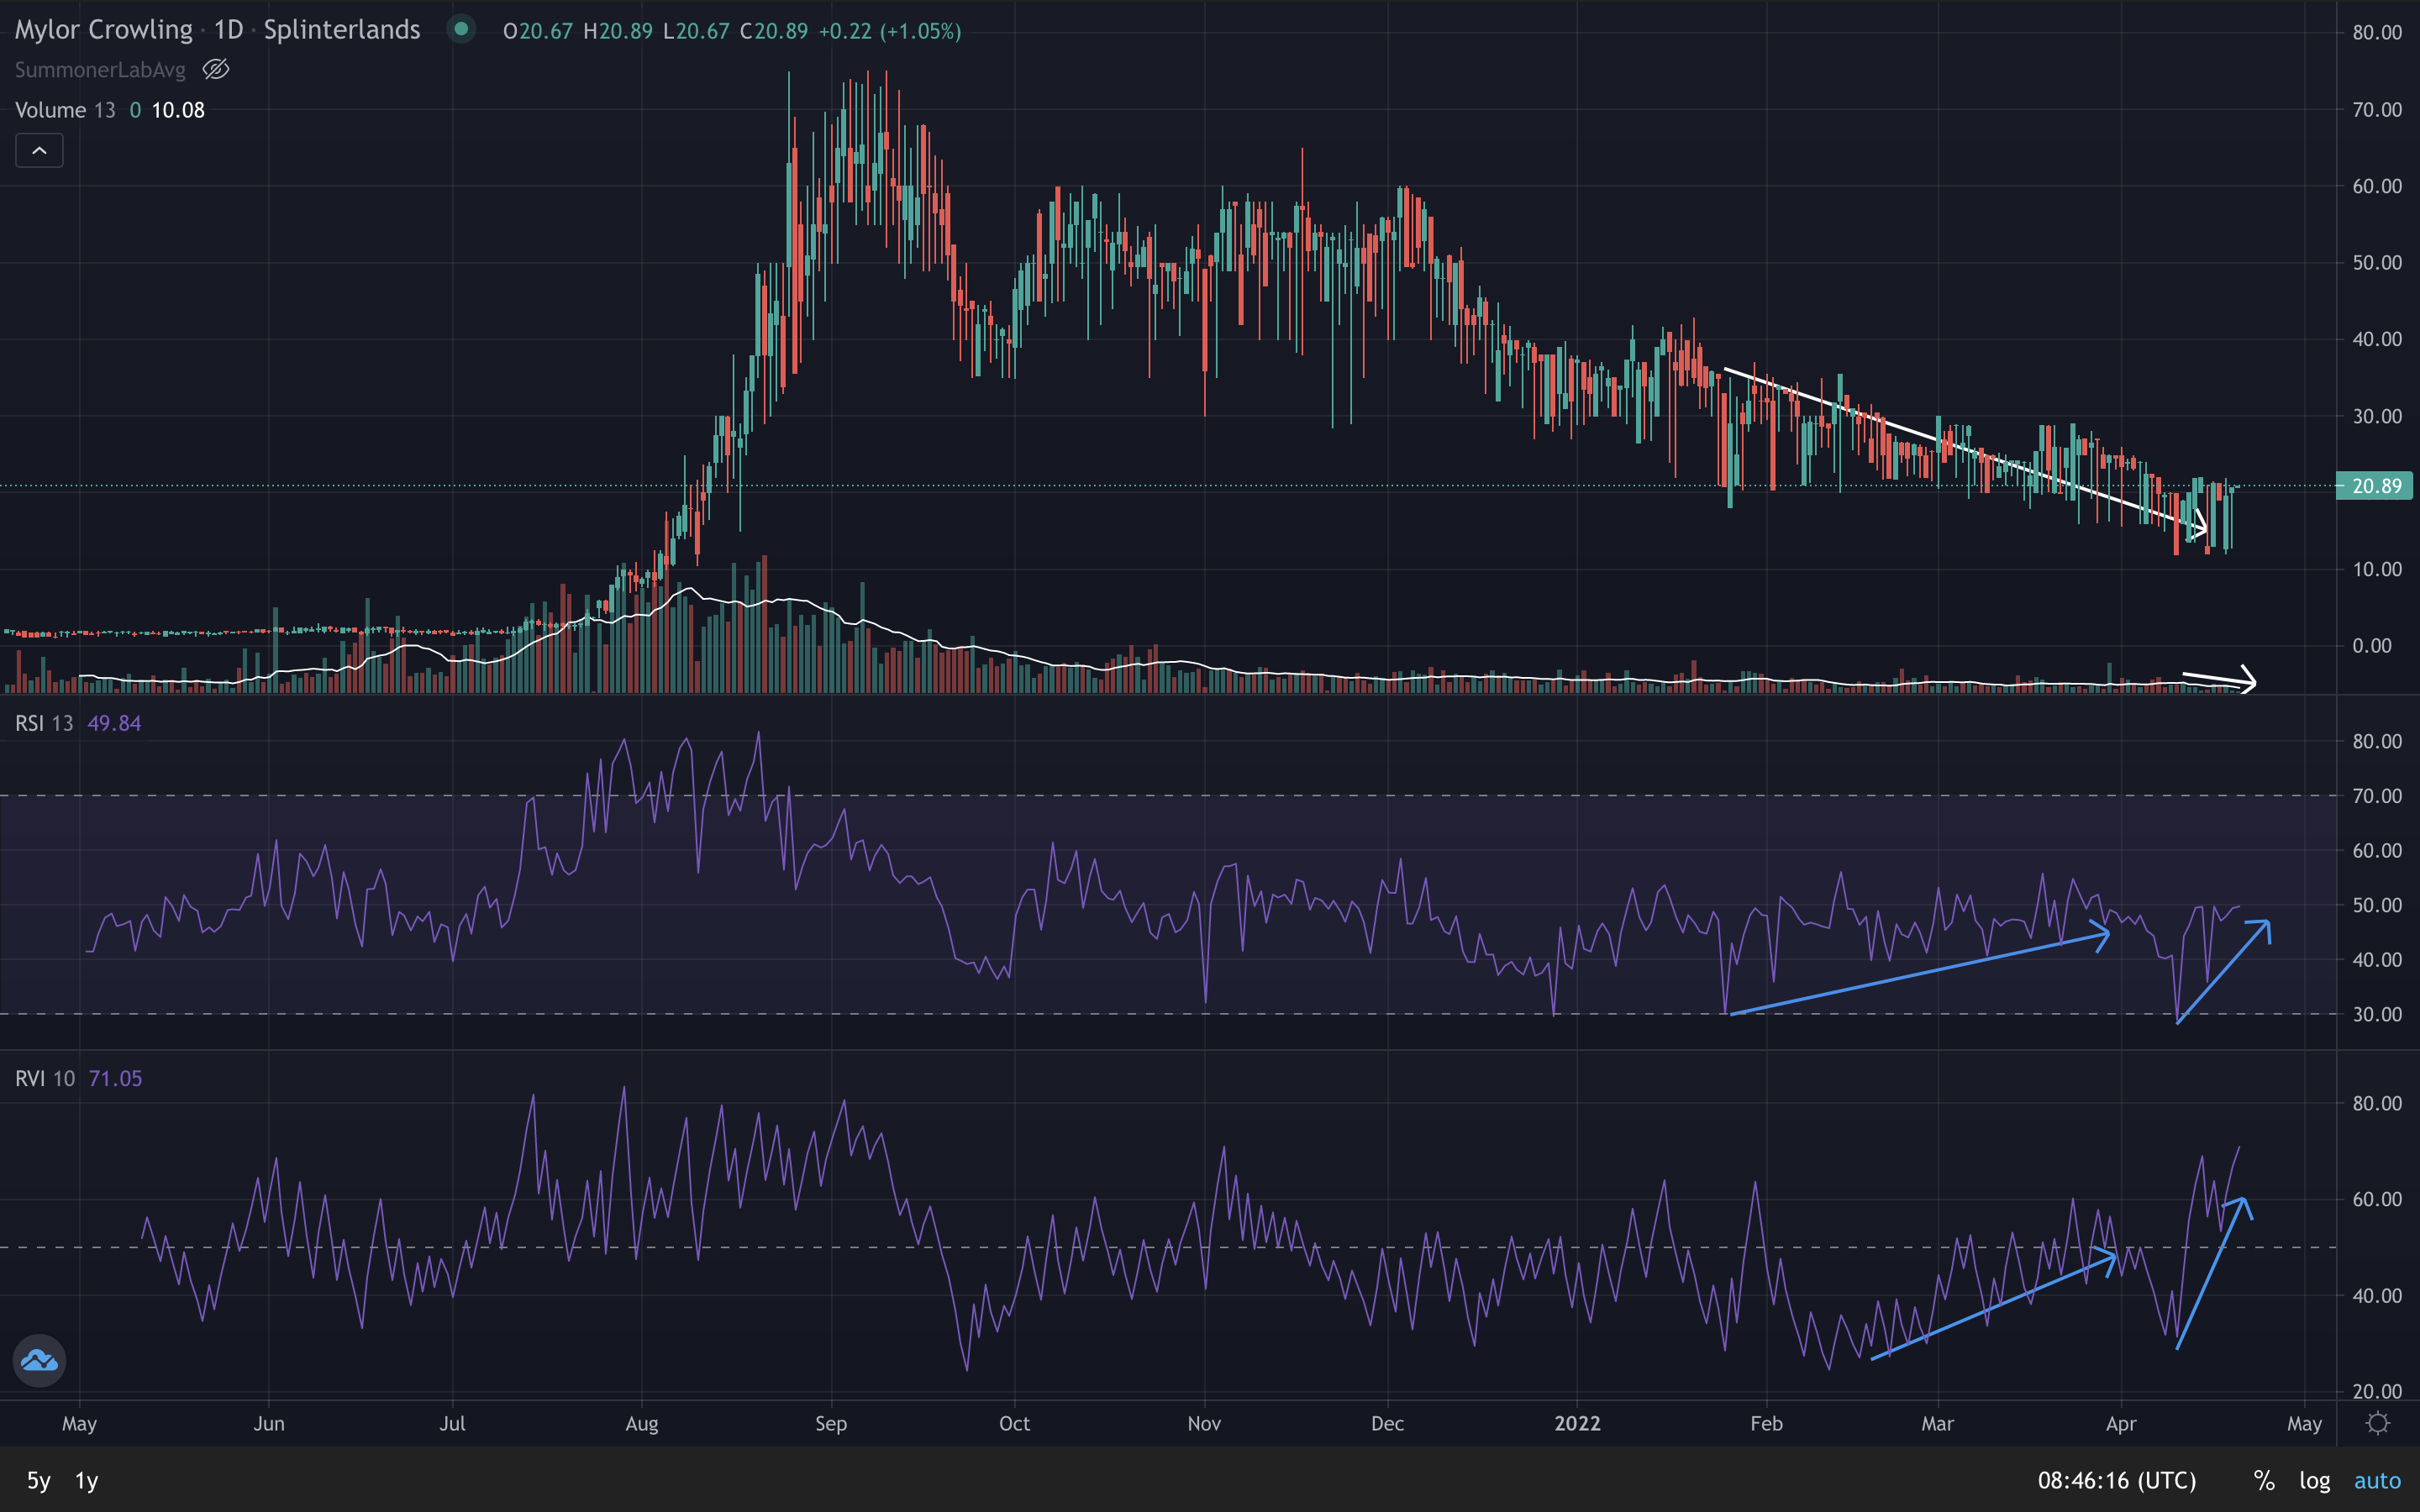
In the past 24h, 15 1bcx cards of Mylor Crowling were negotiated (you can see this information on the Explore table of Summoner Lab), and the bid-ask spread is currently $2.747 or 21.0% of its market value of $13.06. Note that Mylor is not very liquid, as it seems.
That said, Mylor's prices have been on a down trend since September 2021, which accelerated in December 2021, coinciding with the launch of Chaos Legion. We do see a few divergences in the indicators:
- Prices are going downward with a steeper slope since January 2022. Yet, in the most recent week, we see a relative stabilisation of prices (not indicated with arrow).
- Volume have been stable over the downward period, but in the past week, we see a down trend, which diverges from the down/stable trend in prices.
- What's more: since January 2022, both RSI and RVI are diverging from the downward trend in prices, a divergence that accelerated in the past week, with RVI moving into (what we call for other assets) the "buy" territory.
We could be on the verge of a trend reversal, with Mylor prices moving upwards in the coming weeks.
Kelya Frendul
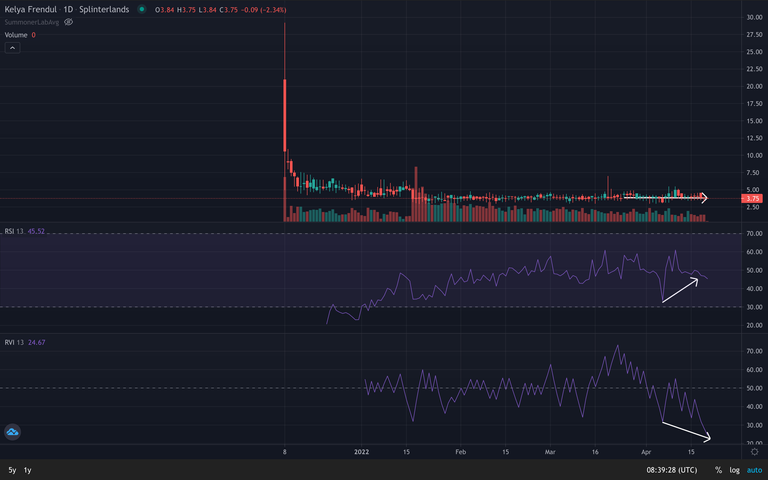
In the past 24h, 243 1bcx cards of Kelya Frendul were negotiated, and the bid-ask spread is currently $0.112 or 3.0% of its market value of $3.7. Kelya is a very liquid card.
The indicators for Kelya Frendul are divergent, but we may not draw a clear conclusion yet.
- Prices seem stable, and so does volume (albeit it seems to be slightly declining).
- RSI, which was moving upward despite stable prices, fell sharply recently, seemed to be recuperating, but is again pointing down.
- RVI is however pointing down and in the "sell" territory.
I believe that what still weights on Kelya Frendul prices is the increasing supply, with many packs being opened and still to be opened. Yet, some fundamental developments may influence demand and diminish the over-supply (see below).
Furious Chicken
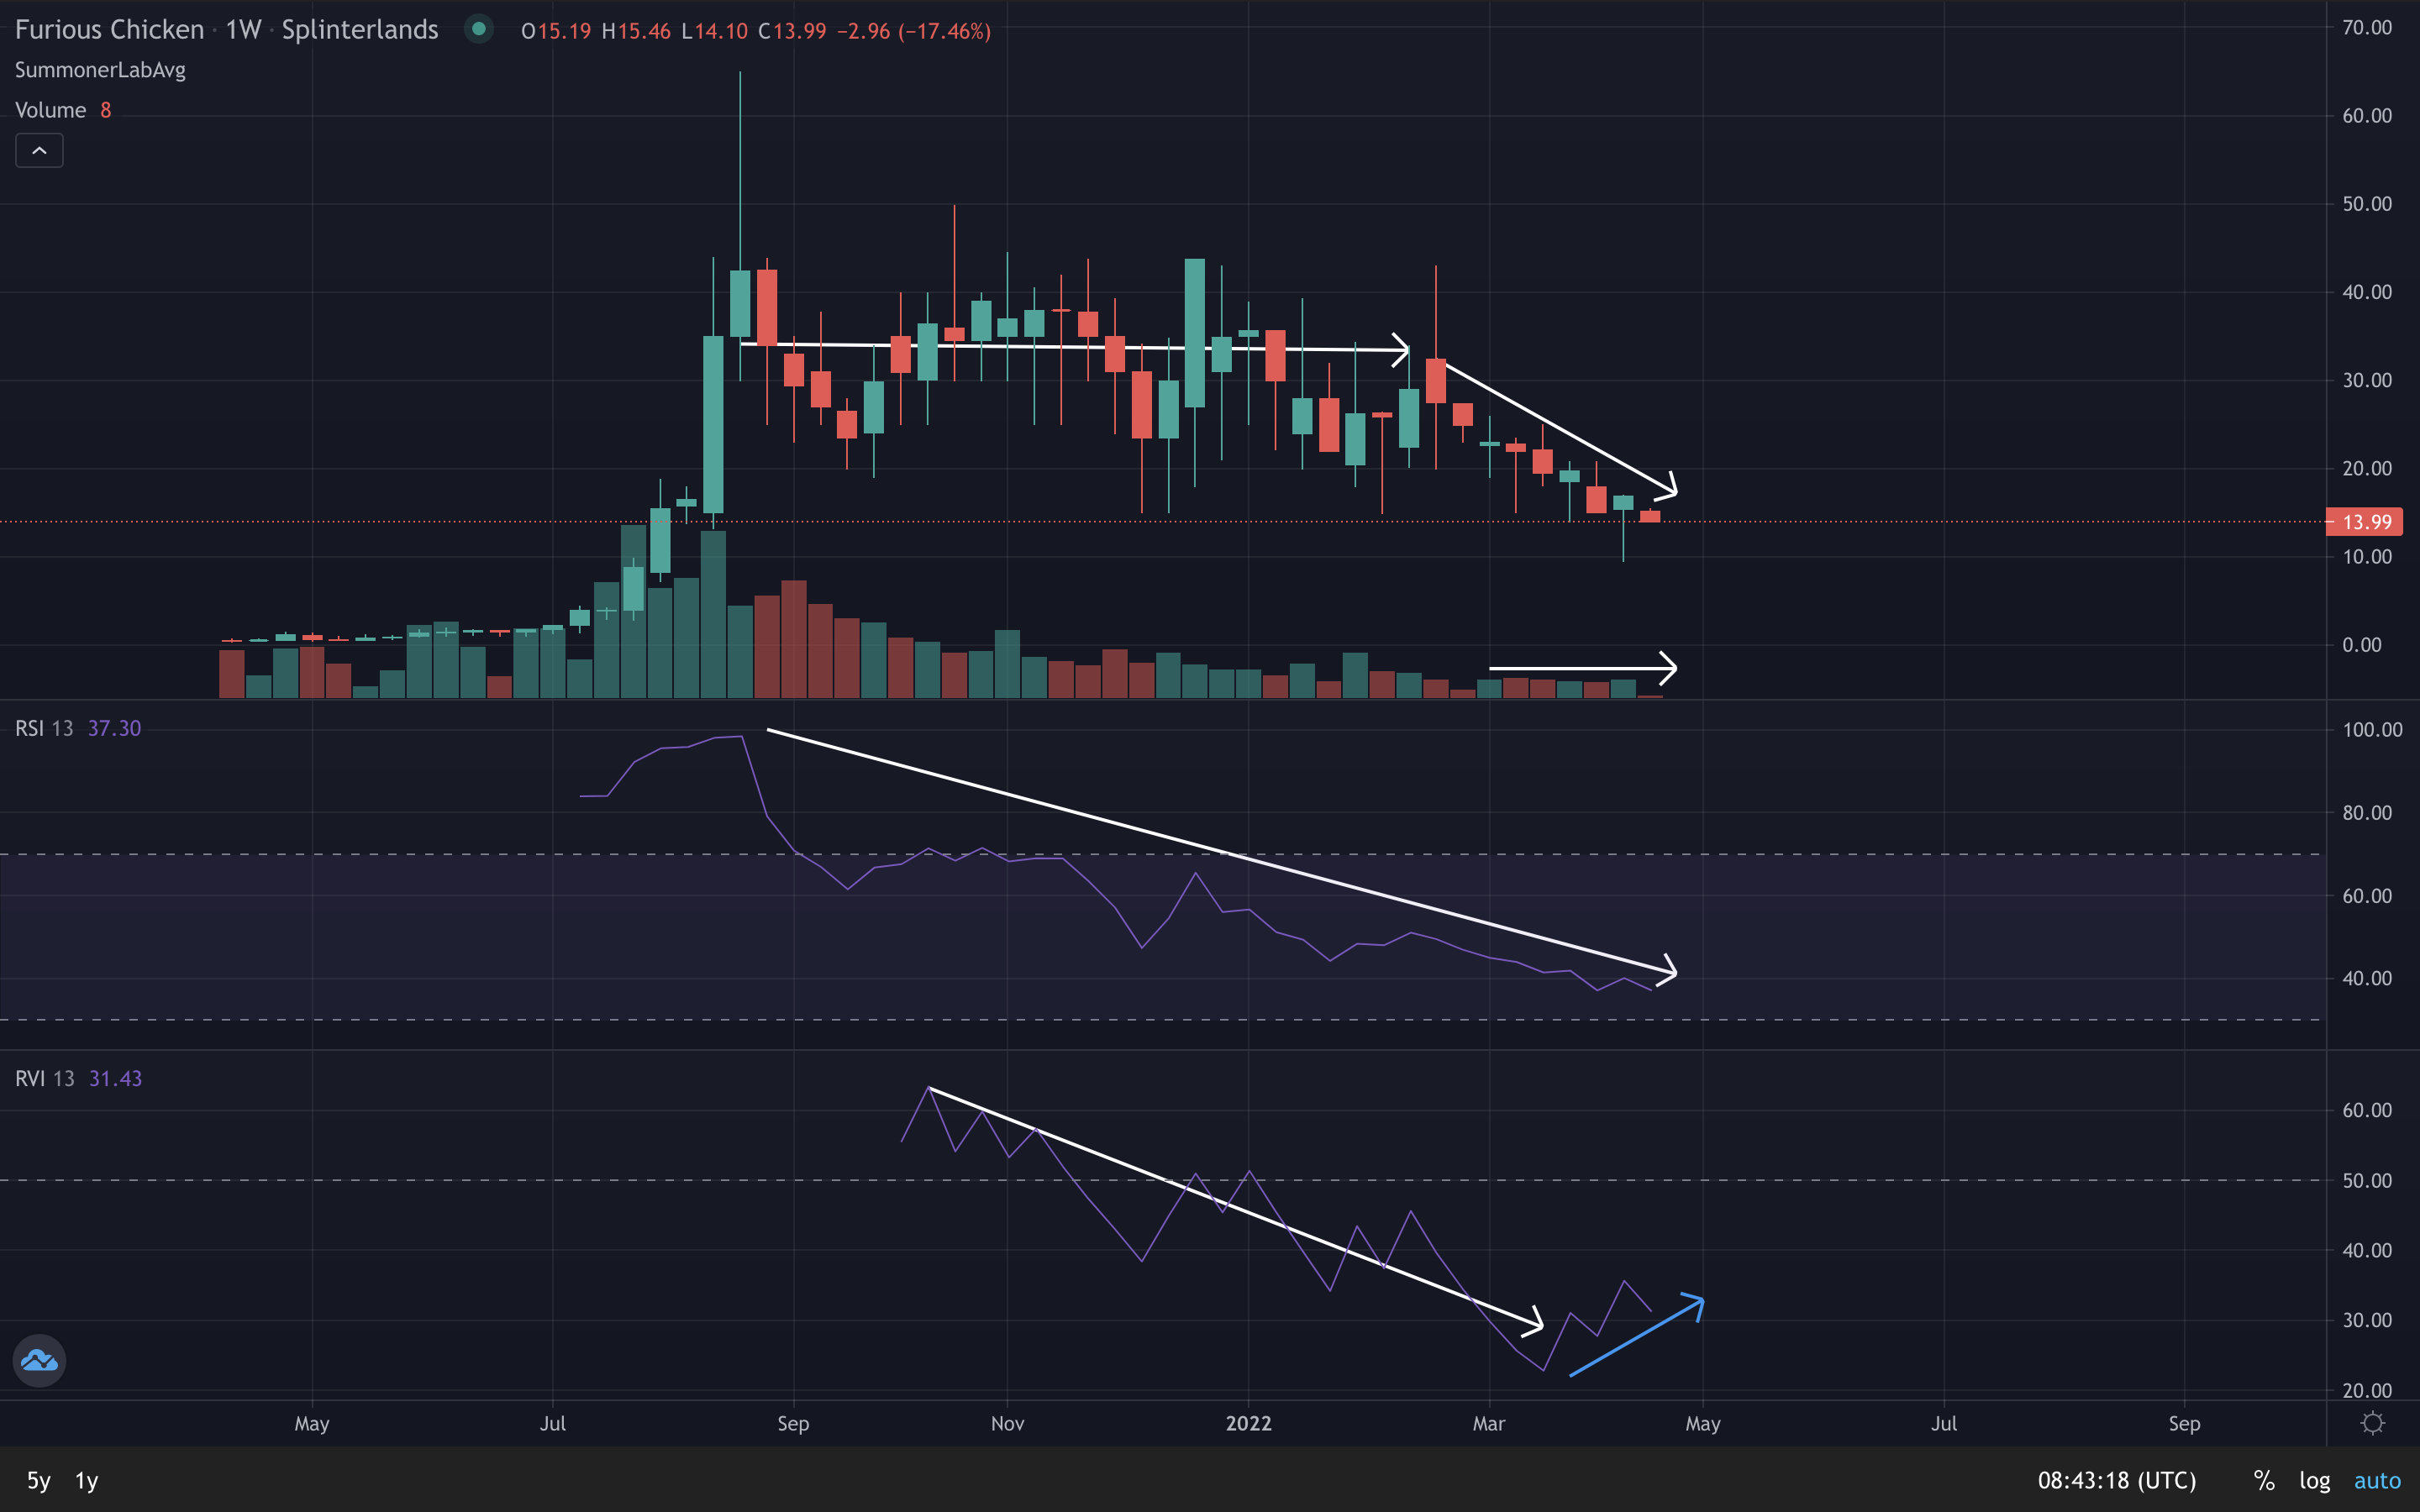
In the past 24h, only one 1bcx cards of Furious Chicken was negotiated, and the bid-ask spread is currently $0,49 or 22.2% of its market value of $2.2 (but just 3.5% of the $13.99 price of the last negotiated card). Note that this is the least liquid card being analysed here.
For Furious Chicken, I'm showing the weekly chart. We do see a divergence, but most indicators seem to point to weakness in the prices:
- Prices going down since February 2022.
- Volume stable over this period.
- RSI in a long down trend.
- RVI is what shows divergence: it seemed to have broken free from the long term down trend, starting to point up.
Furious Chicken is a curious card, because it is very expensive for a rare card. This however does make sense as it is the most used in the game. Its recent fall in prices may have something to do with the availability of new zero mana cards from Chaos Legion - indeed, I expected it to have fallen even more sharply.
Because RVI is the only indicator diverging, and because of fundamental developments (see below), I still don't bet in a trend reversal for furious chicken.
Creeping Ooze
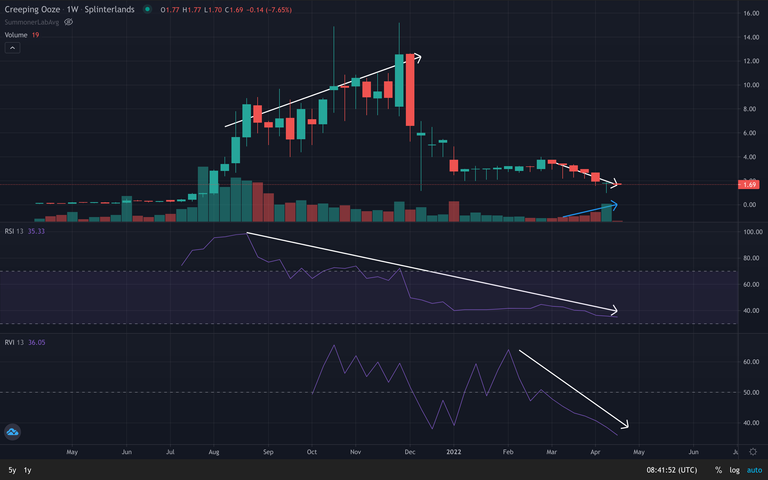
In the past 24h, seven 1bcx cards of Creeping Ooze were negotiated, and the bid-ask spread is currently $0.22 or 42.7% of its market value of $0.515 (12.9% of its last price of $1.7). Bewarer that this is also not a very liquid card.
For creeping use, I use again the weekly chart. We don't see a big divergence here:
- Prices are down.
- Volume is up.
- RSI and RVI are down.
Why I say it's not a divergence even thougb volume is pointing up? , Because when volume increases in a down trend, it tends to reinforce the importance of this trend: agents are buying for ever lower prices. This process may lead to a reversal later on when there aren't more sellers for the lower prices. *Yet, I don't see it happening in the short run.
Djinn Oshannus
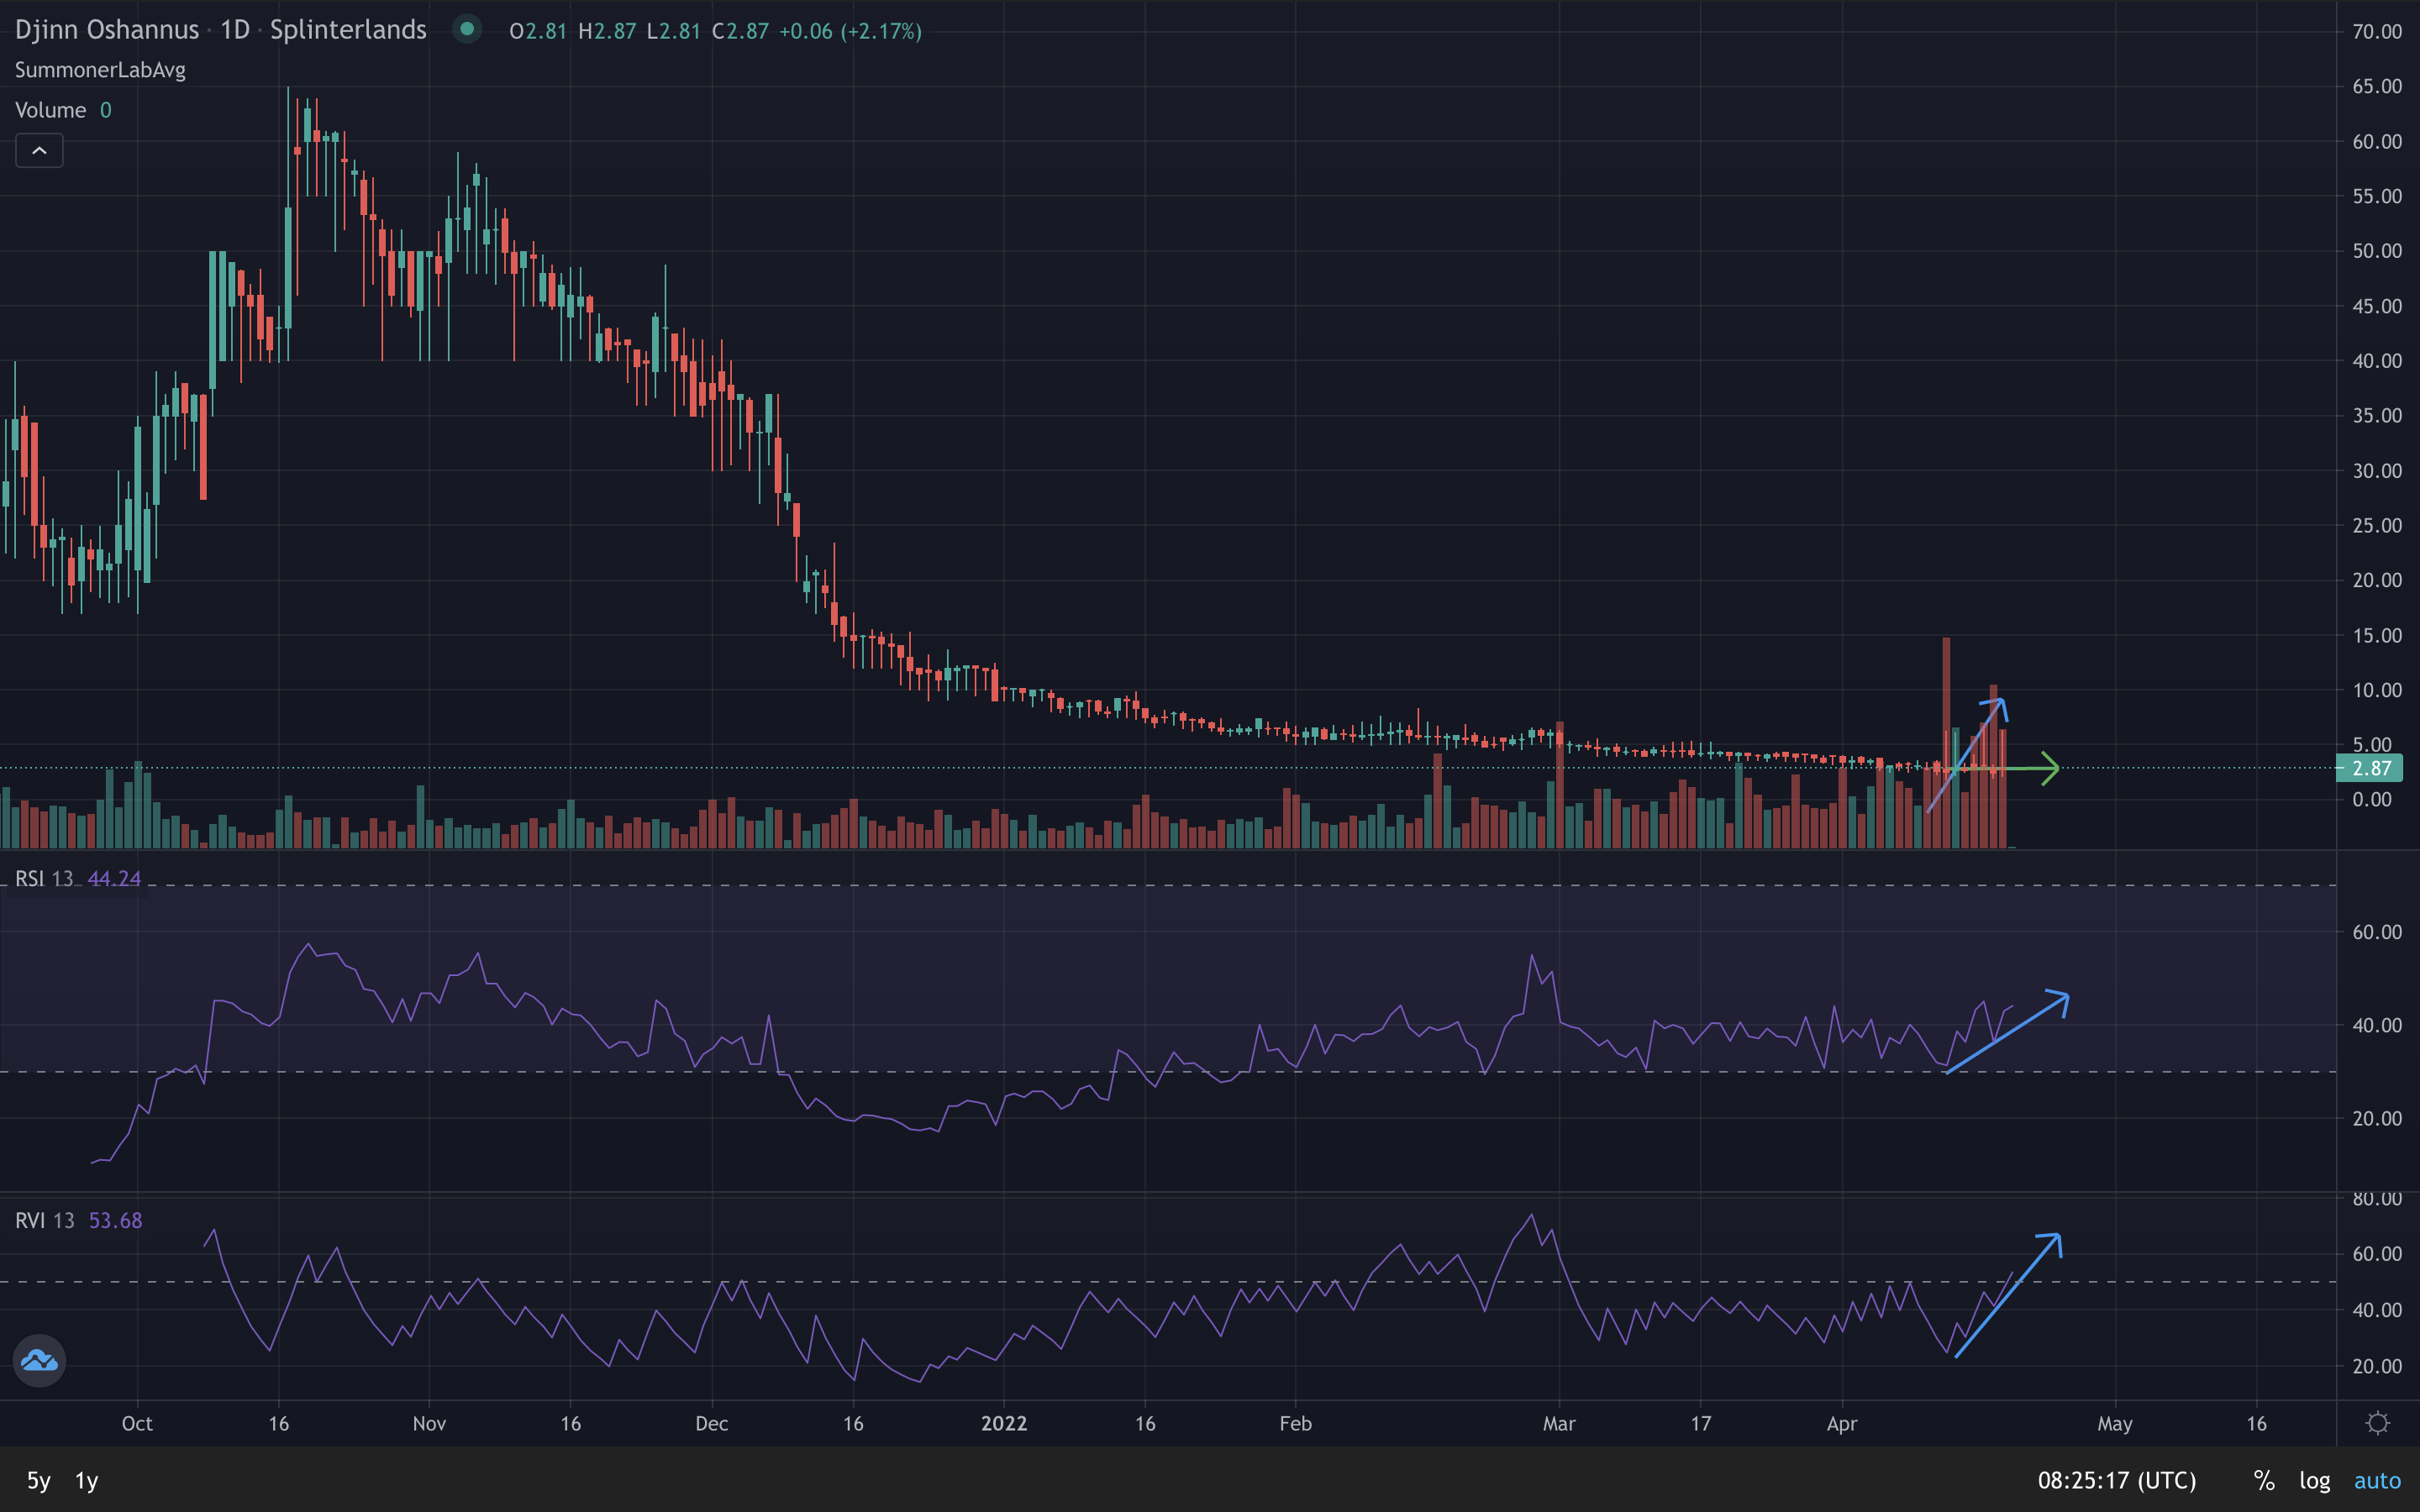
In the past 24h, 630 1bcx cards of Djinn Oshannus were negotiated, and the bid-ask spread is currently $0.308 or 10.2% of its market value of $3.014. Oshannus is the most liquid card being analysed here (and indeed the most liquid legendary card in Splinterlands).
In this daily chart for Djinn Oshannus' prices, I removed the first bars, as they distort the chart (on the first trading day, a Djinn Oshannus sold for $400 - and people complain they paid $40 in October 2021...). We do see important divergences:
- Prices seem to have finally stabilised at around $3 (green arrow). Yet:
- Volume is sharply up in recent days.
- And so are the RSI and RVI, the latter moving into the "buy" territory.
I believe we may have seen a floor for the Djinn Oshannus prices. I would not be surprised with a trend reversal in the short run, especially due to fundamental developments (see below).
Fundamental considerations
While "technically", there are some signs that the prices of Splinterlands' cards may have bottomed, it is crucial to consider fundamental developments (Splinterlands' roadmap below gives us important clues) - some of which are positive for prices (both sale and rental), while others pose risks:
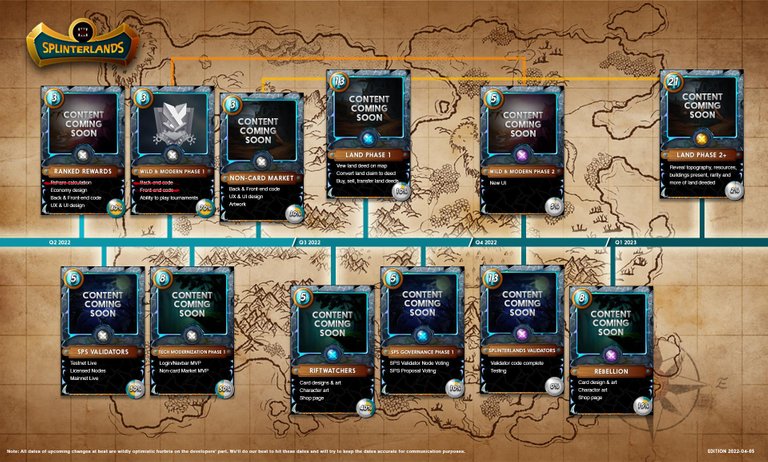
- New Splinterlands' ranked reward system should lead to higher prices: the changes in the way rewards are distributed, with no reward being given to accounts using ghost cards, should lead to an increase in prices (not considering other factors influencing them - what we economists call "all other things equal" or fancily ceteris paribus).
- New reward cards should lead to higher prices: Also the addition of new reward cards should make current ones like Djinn Oshannus harder to get by, which is also a bullish development for the prices of current rewards.
- Launch of Wild and Modern formats may bring dubious impacts on current card prices: Whether the new formats for ranking will impact prices positively or negatively will depend on how many accounts play each. In principle, I would expect cards like Creeping Ooze and Furious Chicken to be negatively affected, as I think accounts that started to play recently (and new accounts) will focus on the Modern format, in which those old cards cannot be used. Yet, if Wild proofs more rewarding, then we should see an influx of players to this format, bringing rewards in both formats to an equilibrium - in this scenario, I think the impact of formats would be neutral.
- Launch of SPS validator licenses could lead to an increase in SPS prices and, consequently, cards: with the launch of the SPS validator node expected to this quarter, we may see an increase of the SPS token. This would likely lead to an increase in card prices, if people use their valued SPS to buy cards.
- Launch of Riftwatchers and Rebellion card sets may bring dubious impact on current card prices: on the one hand, these sets will be bought solely with SPS, which should lead to an increase in SPS prices, and thus have a similar positive effect on current card prices as the SPS validator development. On the other, an increased supply of cards competes for demand with the exiting cards, a process that could lead to a downward price spiral, as seen when Chaos Legion was launched (and still currently).
- Attraction of new players would have a positive impact on card prices: if the Splinterlands' development team succeed in attracting new players (for instance, bringing in guilds that are active in other play-to-earn games; improving the initial experience of new players; or revamping the app so that it is fully functional), this would potentially raise the demand for cards, driving card prices up.
I believe the greater risks are not related to the game developments, however, but to outside developments in the economy and financial markets. Those negative risks are:
- Inflation continuing to go up (due to supply-chain disruptions, for instance), with the FED further increasing its interests, a process that would make riskier assets like crypto currencies and NFT less attractive.
- Crypto winter, triggered by the FED interest increases or any other reason, could lead to a devaluation of all crypto assets, including Splinterlands' tokens and NFT assets (cards and lands). [On the other hand, a bitcoin bullish run to a new ATH would raise the tide for all crypto assets.]
- Other developments leading to economic and financial crisis, like a worsening of the Ukranian war or a new deadly variant of Covid-19.
Take-away
From this long post, I suggest three take-aways:
- Summoner Lab is a powerful tool, worth exploring if you want to find an investment opportunity or decide when to by that card. For less than 2 hive a month, you can make all sorts of technical analysis of Splinterlands' cards. As suggestions to @muwave, I would like to see the inclusion of SPS and DEC charts, and the possibility of creating charts with other periodicity (one hour and 4-hour, basically - which will only be meaningful for the most liquid cards).
- Technical indicators of selected cards are starting to show divergence, which points to an imminent trend reversal which could well become a bullish run.
- Splinterlands' future fundamental developments are mostly bullish, with a few bearish risks. The largest bearish risks fall outside of Splinterlands, and are related to the real economy and other financial markets (like inflation and interest rate dynamics; and the trend in the main crypto markets)
And if you want to start playing Splinterlands, you can use my referral link to register: let me know you did it and I will send you a gift card if you buy a hive account "spellbook" (needed to hold assets as an alternative to creating a hive account elsewhere).
Posted Using LeoFinance Beta


